Appendix: Chapter 2 methodology and data sources


We estimated the mortality and disease burden attributable to dietary and weight-related risk factors by calculating population impact fractions (PIFs), which represent the proportions of disease cases that would be avoided when the risk exposure was changed from a baseline situation to a counterfactual situation. For calculating PIFs, we used the general formula:[1][2][3]
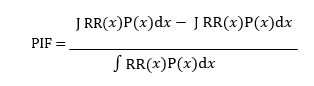
where 𝑅𝑅(𝑥) is the relative risk of disease for risk factor level 𝑥, 𝑃(𝑥) is the number of people in the population with risk factor level 𝑥 in the baseline scenario, and 𝑃′(𝑥) is the number of people in the population with risk factor level 𝑥 in the counterfactual scenario. We assumed that changes in relative risks follow a dose-response relationship, and that PIFs combine multiplicatively, that is 𝑃𝐼𝐹 = 1 − ∏𝑖(1 − 𝑃𝐼𝐹𝑖) where the i’s denote independent risk factors.[4]
The number of avoided deaths due to the change in risk exposure of risk i, Δdeathsi, was calculated by multiplying the associated PIF by disease-specific death rates, DR, and by the number of people alive within a population, P:
𝛥𝑑𝑒𝑎𝑡ℎ𝑠𝑖(𝑟, 𝑠, 𝑎, 𝑑) = 𝑃𝐼𝐹𝑖(𝑟, 𝑠, 𝑎, 𝑑) ∙ 𝐷𝑅(𝑟, 𝑠, 𝑎, 𝑑) ∙ 𝑃(𝑟, 𝑠, 𝑎)
where PIFs are differentiated by region r, sex s, age group a, and disease/cause of death d; the death rates are differentiated by region, sex, age group and disease; the population groups are differentiated by region, sex and age group; and the change in the number of deaths is differentiated by region, sex, age group and disease.
We used publicly available data sources to parameterise the comparative risk analysis. We used consumption data differentiated by age and food group from the Global Dietary Database for the years 2010 and 2018.[5] Mortality and population data was adopted from the Global Burden of Disease project.[6] Baseline data on the weight distribution in each country was adopted from a pooled analysis of population-based measurements undertaken by the non-communicable disease (NCD) Risk Factor Collaboration.[7]
The relative risk estimates that relate the risk factors to the disease endpoints were adopted from meta-analyses of prospective cohort studies for dietary weight-related risks.[8][9][10][11][12][13][14][15][16] In line with the meta-analyses, we included non-linear dose-response relationships for fruits and vegetables, and nuts and seeds, and assumed linear dose-response relationships for the remaining risk factors. As our analysis was primarily focused on mortality from chronic diseases, we focused on adults aged 20 years or older, and we adjusted the relative-risk estimates for attenuation with age based on a pooled analysis of cohort studies focused on metabolic risk factors,[17] in line with other assessments.[18]
SI Table 1 provides an overview of the relative-risk parameters used. For the counterfactual scenario, we defined theoretical minimum risk exposure levels (TMRELs) as follows: 300 grams per day (g/d) for fruits, 500g/d for vegetables, 100g/d for legumes, 20g/d for nuts and seeds, 125g/d for whole grains, 0g/d for red meat, 0g/d for processed meat, 0ml/d for sugar-sweetened beverages, and no underweight, overweight or obesity. The TMRELs are in line with those defined by the Nutrition and Chronic Diseases Expert Group (NutriCoDE),[19] with the exception that we used a higher value for vegetables, and we used zero as minimal risk exposure for red meat, in each case based on a more comprehensive meta-analysis.
The selection of risk-disease associations used in the health analysis was supported by available criteria used to judge the certainty of evidence, such as the Bradford-Hill criteria used by NutriCoDE, the World Cancer Research Fund criteria used by the Global Burden of Disease project,[20] as well as the NutriGrade scoring system (SI Table 2).[21] The quality of evidence in meta-analyses that covered the same risk-disease associations as used here was graded with NutriGrade as moderate or high for all risk-disease pairs included in the analysis.[22] In addition, NutriCoDE graded the evidence for a causal association of 10 of the 15 cardiometabolic risk associations included in the analysis as probable or convincing, and the World Cancer Research Fund graded all five of the cancer associations as probable or convincing.[23] The certainty of evidence grading in each case relates to the general relationship between a risk factor and a health outcome, and not to a specific relative-risk value.
We did not include all available risk-disease associations that were graded as having a moderate certainty of evidence and showed statistically significant results in the meta- analyses that included NutriGrade assessments. That was because for some associations, such as for milk[24] [25]and fish, [26][27] more detailed meta-analyses (with more sensitivity analyses) were available that indicated potential confounding with other major dietary risks. Such sensitivity analyses were not presented in the meta-analyses that included NutriGrade assessments, but they are important for health assessments that evaluate changes in multiple risk factors. Based on a recent analysis, we might also omit fish as a risk factor.[28]
We calculated uncertainty intervals associated with changes in mortality based on standard methods of error propagation and the confidence intervals of the relative risk parameters.
For the error propagation, we approximated the error distribution of the relative risks by a normal distribution and used that side of deviations from the mean which was largest. This method leads to conservative and potentially larger uncertainty intervals as probabilistic methods, such as Monte Carlo sampling, but it has significant computational advantages, and is justified for the magnitude of errors dealt with here (<50%) (see e.g. IPCC Uncertainty Guidelines).
SI Table 1 Relative risk parameters for dietary and weight-related risks
| Food group | Endpoint | Unit | RR mean | RR low | RR high | Reference |
|---|---|---|---|---|---|---|
| Processed meat | CHD | 50 g/d | 1.27 | 1.09 | 1.49 | Bechthold et al (2019) |
| Processed meat | Stroke | 50 g/d | 1.17 | 1.02 | 1.34 | Bechthold et al (2019) |
| Processed meat | Colorectal cancer | 50 g/d | 1.17 | 1.10 | 1.23 | Schwingshackl et al (2018) |
| Processed meat | Type-2 diabetes | 50 g/d | 1.37 | 1.22 | 1.55 | Schwingshackl et al (2017) |
| Red meat | CHD | 100 g/d | 1.15 | 1.08 | 1.23 | Bechthold et al (2019) |
| Red meat | Stroke | 100 g/d | 1.12 | 1.06 | 1.17 | Bechthold et al (2019) |
| Red meat | Colorectal cancer | 100 g/d | 1.12 | 1.06 | 1.19 | Schwingshackl et al (2018) |
| Red meat | Type-2 diabetes | 100 g/d | 1.17 | 1.08 | 1.26 | Schwingshackl et al (2017) |
| Sugary drinks | CHD |
250 ml/d 250 ml/d |
1.17 1.28 |
1.10 1.12 |
1.27 1.46 |
Xi et al (2015) Imamura et al (2015) |
| Sugary drinks | Type-2 diabetes | 100 g/d | 0.95 | 0.92 | 0.99 | Aune et al (2017) |
| Fruits | CHD | 100 g/d | 0.77 | 0.70 | 0.84 | Aune et al (2017) |
| Fruits | Stroke | 100 g/d | 0.94 | 0.91 | 0.97 | Aune et al (2017) |
| Fruits | Cancer | 100 g/d | 0.84 | 0.80 | 0.88 | Aune et al (2017) |
| Vegetables | CHD | 100 g/d | 0.93 | 0.91 | 0.95 | Aune et al (2017) |
| Vegetables | Cancer | 57 g/d | 0.86 | 0.78 | 0.94 | Afshin et al (2014) |
| Legumes | CHD | 28 g/d | 0.71 | 0.63 | 0.80 | Aune et al (2016) |
| Nuts | CHD | 30 g/d | 0.87 | 0.85 | 0.90 | Aune et al (2016b) |
| Whole grains | Cancer | 30 g/d | 0.95 | 0.93 | 0.97 | Aune et al (2016b) |
| Whole grains | Type-2 diabetes | 30 g/d | 0.65 | 0.61 | 0.70 | Aune et al (2016b) |
| Underweight | CHD | 15<BMI<18.5 | 1.17 | 1.09 | 1.24 | Global BMI Collab (2016) |
| Underweight | Stroke | 15<BMI<18.5 | 1.37 | 1.23 | 1.53 | Global BMI Collab (2016) |
| Underweight | Cancer | 15<BMI<18.5 | 1.10 | 1.05 | 1.16 | Global BMI Collab (2016) |
| Underweight | Respiratory disease | 15<BMI<18.5 | 2.73 | 2.31 | 3.23 | Global BMI Collab (2016) |
| Overweight | CHD | 25<BMI<30 | 1.34 | 1.32 | 1.35 | Global BMI Collab (2016) |
| Overweight | Stroke | 25<BMI<30 | 1.11 | 1.09 | 1.14 | Global BMI Collab (2016) |
| Overweight | Cancer | 25<BMI<30 | 1.10 | 1.09 | 1.12 | Global BMI Collab (2016) |
| Overweight | Respiratory disease | 25<BMI<30 | 0.90 | 0.87 | 0.94 | Global BMI Collab (2016) |
| Overweight | Type-2 diabetes | 25<BMI<30 | 1.88 | 1.56 | 2.11 |
Prosp Studies Collab (2009) |
|
Obesity (grade 1) |
CHD | 30<BMI<35 | 2.02 | 1.91 | 2.13 | Global BMI Collab (2016) |
|
Obesity (grade 1) |
Stroke | 30<BMI<35 | 1.46 | 1.39 | 1.54 | Global BMI Collab (2016) |
|
Obesity (grade 1) |
Cancer | 30<BMI<35 | 1.31 | 1.28 | 1.34 | Global BMI Collab (2016) |
|
Obesity (grade 1) |
Respiratory disease | 30<BMI<35 | 1.16 | 1.08 | 1.24 | Global BMI Collab (2016) |
|
Obesity (grade 1) |
Type-2 diabetes | 30<BMI<35 | 3.53 | 2.43 | 4.45 |
Prosp Studies Collab (2009) |
| Obesity (grade 2) | CHD | 30<BMI<35 | 2.81 | 2.63 | 3.01 | Global BMI Collab (2016) |
| Obesity (grade 2) | Stroke | 30<BMI<35 | 2.11 | 1.93 | 2.30 | Global BMI Collab (2016) |
| Obesity (grade 2) | Cancer | 30<BMI<35 | 1.57 | 1.50 | 1.63 | Global BMI Collab (2016) |
| Obesity (grade 2) | Respiratory disease | 30<BMI<35 | 1.79 | 1.60 | 1.99 | Global BMI Collab (2016) |
| Obesity (grade 2) | Type-2 diabetes | 30<BMI<35 | 6.64 | 3.80 | 9.39 |
Prosp Studies Collab (2009) |
| Obesity (grade 3) | CHD | 30<BMI<35 | 3.81 | 3.47 | 4.17 | Global BMI Collab (2016) |
| Obesity (grade 3) | Stroke | 30<BMI<35 | 2.33 | 2.05 | 2.65 | Global BMI Collab (2016) |
| Obesity (grade 3) | Cancer | 30<BMI<35 | 1.96 | 1.83 | 2.09 | Global BMI Collab (2016) |
| Obesity (grade 3) | Respiratory disease | 30<BMI<35 | 2.85 | 2.43 | 3.34 | Global BMI Collab (2016) |
| Obesity (grade 3) | Type-2 diabetes | 30<BMI<35 | 12.49 | 5.92 | 19.82 |
Prosp Studies Collab (2009) |
Notes: The parameters are mean and low and high values of 95% confidence intervals. We used non-linear dose-response relationships for fruits and vegetables, and nuts and seeds, as specified in the references, and we used linear dose-response relationships for the remaining risk factors.
SI Table 2 Overview of existing ratings on the certainty of evidence for a statistically significant association between a risk factor and a disease endpoint
| Food group | Endpoint | Association | Certainty of evidence |
|---|---|---|---|
| Fruits | CHD | Reduction | NutriCoDE: probable or convincing |
| Fruits | CHD | Reduction | NutriGrade: moderate quality of meta-evidence |
| Fruits | Stroke | Reduction | NutriCoDE: probable or convincing |
| Fruits | Stroke | Reduction | NutriGrade: moderate quality of meta-evidence |
| Fruits | Cancer | Reduction | WCRF: strong evidence (probable) for some cancers |
| Fruits | Cancer | Reduction | NutriGrade: moderate quality of meta-evidence for colorectal cancer |
| Vegetables | CHD | Reduction | NutriCoDE: probable or convincing |
| Vegetables | CHD | Reduction | NutriGrade: moderate quality of meta-evidence |
| Vegetables | Cancer | Reduction | WCRF: strong evidence (probable) for non-starchy vegetables and some cancers |
| Vegetables | Cancer | Reduction | NutriGrade: moderate quality of meta-evidence for colorectal cancer |
| Legumes | CHD | Reduction | NutriCoDE: probable or convincing |
| Legumes | CHD | Reduction | NutriGrade: moderate quality of meta-evidence |
| Nuts and seeds | CHD | Reduction | NutriCoDE: probable or convincing |
| Nuts and seeds | CHD | Reduction | NutriGrade: moderate quality of meta-evidence |
| Whole grains | CHD | Reduction | NutriCoDE: probable or convincing |
| Whole grains | CHD | Reduction | NutriGrade: moderate quality of meta-evidence |
| Whole grains | Cancer | Reduction | WCRF: strong evidence (probable) for colorectal cancer |
| Whole grains | Cancer | Reduction | NutriGrade: moderate quality of meta-evidence for colorectal cancer |
| Whole grains | Type-2 diabetes | Reduction | NutriCoDE: probable or convincing |
| Whole grains | Type-2 diabetes | Reduction | NutriGrade: moderate quality of meta-evidence |
| Sugary drinks | CHD | Increase | NutriCoDE: probable or convincing |
| Sugary drinks | CHD | Increase | NutriGrade: moderate quality of meta-evidence |
| Sugary drinks | Type-2 diabetes | Increase | NutriCoDE: probable or convincing |
| Sugary drinks | Type-2 diabetes | Increase | NutriGrade: moderate quality of meta-evidence |
| Red meat | CHD | Increase | NutriGrade: moderate quality of meta-evidence |
| Red meat | Stroke | Increase | NutriGrade: moderate quality of meta-evidence |
| Red meat | Cancer | Increase |
WCRF: strong evidence (probable) for colorectal cancer increase |
| Red meat | Cancer | Increase | NutriGrade: moderate quality of meta-evidence for colorectal cancer |
| Red meat | Type-2 diabetes | Increase | NutriCoDE: probable or convincing |
| Red meat | Type-2 diabetes | Increase | NutriGrade: moderate quality of meta-evidence |
| Processed meat | CHD | Increase | NutriCoDE: probable or convincing |
| Processed meat | CHD | Increase | NutriGrade: moderate quality of meta-evidence |
| Processed meat | Stroke | Increase | NutriGrade: moderate quality of meta-evidence |
| Processed meat | Cancer | Increase |
WCRF: strong evidence (convincing) for colorectal cancer |
| Processed meat | Cancer | Increase | NutriGrade: moderate quality of meta-evidence for colorectal cancer |
| Processed meat | Type-2 diabetes | Increase | NutriGrade: high quality of meta-evidence |
Notes: The ratings include those of the Nutrition and Chronic Diseases Expert Group (NutriCoDE), the World Cancer Research Fund, and NutriGrade. The ratings relate to the risk-disease associations in general, and not to the specific relative-risk factor used for those associations in this analysis. NutriCoDE = Nutrition and Chronic Diseases Expert Group. NutriGrade = Grading of Recommendations Assessment, Development, and Evaluation (GRADE) tailored to nutrition research. WCRF = World Cancer Research Fund.
We estimated the environmental impacts of diets by using a global dataset of country and crop-specific environmental footprints for greenhouse gas emissions, cropland use, fresh-water use, and nitrogen and phosphorus application (SI Table 3).[29] The footprints are based on global datasets on environmental resource use in the producing region,[30][31][32] which have been converted to consumption-related footprints by using a food systems model that connects food production and consumption across regions. The model distinguished several steps along the food chain: primary production; trade in primary commodities; processing to oils, oil cakes and refined sugar; use of feed for animals; and trade in processed commodities and animals. It was parameterised with data from the International Model for Policy Analysis of Agricultural Commodities and Trade (IMPACT) on food production, processing factors and feed requirements for 62 agricultural commodities and 159 countries.
For greenhouse gas emissions, we used a regionalised and harmonised set of life-cycle assessments for analysing the full set of greenhouse gas emissions associated with the food system, including CO2 emissions associated with land use changes. However, for the analysis of emissions in proportion to environmental limits, we focused on the non-CO2 emissions of agriculture, in particular methane and nitrous oxide, in line with methodology followed by the International Panel on Climate Change and estimates of emissions trajectories in line with fulfilling the Paris Climate Agreement. In that analysis, we adopted the data on greenhouse gas emissions from country-specific analyses of methane and nitrous oxide emissions from crops and livestock. Non-CO2 emissions of fish and seafood were calculated based on feed requirements and feed-related emissions of aquaculture, and on the ratio between wild-caught and farmed fish production.
Data on cropland and consumptive fresh-water use from surface and groundwater (also termed blue water) were adopted from the IMPACT model. To derive commodity-specific footprints, we divided use data by data on primary production, and calculated the footprints of processed goods (vegetable oils, refined sugar) by using country-specific conversion ratios, and splitting co-products (oils and oil meals) by economic value to avoid double counting. We used country-specific feed requirements for terrestrial animals to derive the cropland and fresh-water footprints for meat and dairy, and we used global feed requirements for aquaculture and the ratio between wild-caught and farmed fish production to derive the cropland and fresh-water footprints for fish and seafood. Data on total land use (which in addition to cropland also includes pasture) were adopted from a harmonised set of life-cycle assessments, and data on fertiliser application rates of nitrogen and phosphorous were adopted from the International Fertilizer Industry Association.
SI Table 3 Environmental footprints of food commodities, 2010 and 2050
| Food groups |
Greenhouse gas emissions (kgCO2eq/kg) |
Greenhouse gas emissions (kgCO2eq/kg) |
Cropland use (m2/kg) | Cropland use (m2/kg) | Fresh-water use (m3/kg) | Fresh-water use (m3/kg) | Nitrogen use (kgN/t) | Nitrogen use (kgN/t) | Phosphorus use (kgP/t) | Phosphorus use (kgP/t) |
|---|---|---|---|---|---|---|---|---|---|---|
| 2010 | 2050 | 2010 | 2050 | 2010 | 2050 | 2010 | 2050 | 2010 | 2050 | |
| Wheat | 0.23 | 0.21 | 3.36 | 2.46 | 0.49 | 0.37 | 28.73 | 19.78 | 4.39 | 2.01 |
| Rice | 1.18 | 0.90 | 3.51 | 2.78 | 1.07 | 0.89 | 36.64 | 25.07 | 5.20 | 2.28 |
| Maize | 0.19 | 0.17 | 1.98 | 1.40 | 0.15 | 0.12 | 22.77 | 14.36 | 3.57 | 1.55 |
| Other grains | 0.29 | 0.22 | 6.17 | 4.43 | 0.17 | 0.14 | 16.39 | 9.82 | 2.72 | 0.97 |
| Roots | 0.07 | 0.06 | 0.69 | 0.52 | 0.04 | 0.04 | 3.60 | 2.07 | 0.71 | 0.30 |
| Legumes | 0.23 | 0.19 | 11.11 | 6.89 | 0.94 | 0.61 | 0.00 | 0.00 | 0.00 | 0.00 |
| Soybeans | 0.12 | 0.09 | 3.95 | 3.14 | 0.14 | 0.15 | 2.75 | 1.75 | 5.88 | 3.17 |
| Nuts & seeds | 0.69 | 0.65 | 6.39 | 5.13 | 0.43 | 0.33 | 14.16 | 10.84 | 2.10 | 1.17 |
| Vegetables | 0.06 | 0.07 | 0.49 | 0.34 | 0.09 | 0.06 | 9.55 | 6.32 | 1.67 | 0.81 |
| Oil crops | 0.70 | 0.64 | 3.12 | 2.37 | 0.22 | 0.19 | 13.33 | 8.50 | 2.86 | 1.32 |
| Fruits (temperate) | 0.08 | 0.08 | 1.18 | 0.97 | 0.33 | 0.28 | 12.73 | 8.57 | 1.91 | 0.92 |
| Fruits (tropical) | 0.09 | 0.10 | 0.94 | 0.62 | 0.32 | 0.23 | 10.27 | 6.10 | 1.58 | 0.70 |
| Fruits (starchy) | 0.11 | 0.10 | 0.88 | 0.59 | 0.11 | 0.08 | 6.15 | 3.76 | 1.05 | 0.48 |
| Sugar | 0.19 | 0.19 | 1.67 | 1.35 | 1.22 | 0.88 | 22.34 | 15.26 | 3.84 | 1.86 |
| Palm oil | 1.85 | 2.03 | 3.10 | 2.39 | 0.00 | 0.00 | 22.34 | 16.29 | 3.57 | 1.85 |
| Vegetable oil | 0.67 | 0.63 | 10.31 | 8.46 | 0.47 | 0.45 | 42.73 | 28.19 | 11.47 | 5.66 |
| Beef | 36.78 | 40.36 | 4.21 | 2.78 | 0.22 | 0.17 | 27.29 | 17.16 | 5.36 | 2.29 |
| Lamb | 36.73 | 37.21 | 6.24 | 4.48 | 0.49 | 0.42 | 27.52 | 21.82 | 4.94 | 2.47 |
| Pork | 3.14 | 3.25 | 6.08 | 4.90 | 0.35 | 0.29 | 51.52 | 34.19 | 8.87 | 4.05 |
| Poultry | 1.45 | 1.39 | 6.59 | 5.18 | 0.40 | 0.36 | 50.20 | 36.00 | 9.02 | 4.35 |
| Eggs | 1.61 | 1.48 | 6.86 | 5.19 | 0.44 | 0.39 | 51.22 | 35.09 | 8.81 | 4.18 |
| Milk | 1.28 | 1.39 | 1.34 | 1.01 | 0.08 | 0.08 | 6.32 | 4.63 | 1.58 | 0.78 |
| Shellfish | 0.03 | 0.04 | 0.36 | 0.46 | 0.03 | 0.04 | 2.19 | 2.39 | 0.50 | 0.40 |
| Fish (freshwater) | 0.12 | 0.12 | 1.51 | 1.37 | 0.10 | 0.10 | 11.26 | 8.39 | 2.37 | 1.29 |
| Fish (pelagic) | 0.00 | 0.00 | 0.00 | 0.00 | 0.00 | 0.00 | 0.00 | 0.00 | 0.00 | 0.00 |
| Fish (demersal) | 0.01 | 0.01 | 0.13 | 0.20 | 0.01 | 0.01 | 0.75 | 0.99 | 0.19 | 0.18 |
Notes: Values shown are global averages per kilogram of product. Footprints for animal products represent feed- related impacts, except for greenhouse gas emissions of livestock, which also have a direct component. Footprints for fish and seafood represent feed-related impacts of aquaculture production weighted by total production volumes. The global averages account for expected efficiency improvements, such as improved feed for livestock, and changes in production by 2050, such as increases in extensive beef production in middle-income countries. The analysis is based on country-specific values.
We analysed whether diets were in line with global health and environmental targets by modelling their universal adoption across all countries for which we have consumption and environmental data. With the exception of the proportional NCD target, all targets were expressed in absolute terms, e.g. not exceeding global greenhouse gas emissions (related to food consumption) of a certain amount. In context of these absolute targets, the rationale of the global sustainability test is to assess whether global targets can be met without imposing exceptions for one country or group of countries. From this equity perspective, a country whose diet fails the test is, in effect, outsourcing its responsibility towards fulfilling the target, and other countries would have to divert from its diet to meet it.
The targets included are the Sustainable Development Goal of reducing premature mortality from NCDs by a third, the Paris Agreement to limit global warming to below 2°C, the Aichi Biodiversity Target of limiting the rate of land- use change, as well as the Sustainable Development Goals and planetary boundaries related to fresh-water use, and nitrogen and phosphorus pollution (SI Table 4).
For deriving the target values, we isolated the diet-related portion of the different health and environmental targets, such as the emissions budget allocated to food production under a climate stabilisation pathway in line with fulfilling the Paris Climate Agreement,[33] which mirrored how the planetary boundaries for the food system were derived from the overall boundary values. For NCD risks, we took into account what proportion of NCD risks are due to dietary risks.[34] When targets were expressed for future years, we used projections of environmental footprints that included improvements in technologies and management practices, including reductions in food loss and waste, along a middle-of-the-road socioeconomic development pathway. We summarise the derivation of the target values in SI Table 4.
SI Table 4 Overview of global health and environmental targets and their derivation
| Global targets | Comment | Implementation |
|---|---|---|
|
NCD Agenda |
Sustainable Development Goal (SDG) 3.4 is to “reduce by one third premature mortality from NCDs through prevention and treatment, and promote mental health and wellbeing”, which builds on the World Health Organization (WHO) “25x25” NCD target. | According to the Global Burden of Disease project (GBD 2017), imbalanced diets and weight contribute more than half to preventable causes of NCD deaths (the rest is tobacco, alcohol and low physical activity). Applying this proportion to overall reductions yields a target for diet-related reductions of around 18.5%. |
|
Paris Climate Agreement |
The Paris Agreement's long-term goal is to keep the increase in global average temperature to well below 2°C above pre-industrial levels; and to limit the increase to 1.5°C, since this would substantially reduce the risks and effects of climate change. The goal is reflected in SDG 13 and in the planetary boundary for climate change. |
The target for agricultural emissions in line with the 2°C target was derived as 4.7 (4.3–5.3) GtCO2-eq (Wollenberg et al, 2016; Springmann et al, 2018). We adjusted this value for the proportion of emissions related specifically to food consumption (92% of emissions of the whole food system, according to Springmann et al, 2018). |
|
Aichi Biodiversity Targets |
Target 5: By 2020, the rate of loss of all natural habitats, including forests, is at least halved and where feasible brought close to zero, and degradation and fragmentation is significantly reduced. The target is related to SDG 15 and the planetary boundary for land- system change. |
Contribute to target by not increasing pressure to convert natural land into cropland (or pastures), in line with the food-related planetary boundary for land-systems change (Steffen et al, 2015; Springmann et al, 2018). The planetary boundary value was set to the extent of current cropland (+/- 16%). We internally recalculated the value for consistency with the baseline parameters and our focus on food available for consumption (9.9Mkm2, 8.3–11.5). |
|
SDG target on water withdrawals |
SDG 6.4: By 2030, substantially increase water-use efficiency across all sectors and ensure sustainable withdrawals and supply of freshwater to address water scarcity and substantially reduce the number of people suffering from water scarcity. The goal is in line with the planetary boundary for fresh-water use. |
Adopt the food-related planetary-boundary target of maintaining environmental flow requirements by limiting agricultural fresh-water use to below 2,000km3, with a range of 800–3,350 km3 (Springmann et al, 2018). We adjusted the value for the proportion of the food system attributed to diets (1,600km3, 640–2,600). |
| SDG target on nutrient pollution |
SDG 14.1: By 2025, prevent and significantly reduce marine pollution of all kinds, in particular from land-based activities, including marine debris and nutrient pollution. The goal is in line with the planetary boundary for biogeochemical flows of nitrogen and phosphorus. |
Adopt the food-related planetary-boundary target for nitrogen and phosphorus application in line with limiting eutrophication risk (de Vries et al, 2013; Springmann et al, 2018). We recalculated the value for our focus on consumption-related impacts by applying the original risk fractions to estimates of baseline use, which yielded target values of 51TgN (38–83) and 11TgP (5.6–12.9). |
This page was updated on 17 October 2022.
Share Appendix: Chapter 2 methodology and data sources
Downloads
- English Appendix 1_Chapter Methodology and data sources_2021 Global Nutrition Report (PDF 269.8kB) 2021 Global Nutrition Report (PDF 3.9MB) Launch presentation - 2021 Global Nutrition Report (PDF 1.5MB)
- French 2021 Global Nutrition Report French (PDF 3.1MB)
- Spanish 2021 Global Nutrition Report Spanish (PDF 3.0MB)
Download the 2021 Global Nutrition Report
Download the reportFootnotes
-
Return to source text
Murray CJL, Ezzati M, Lopez AD, Rodgers A, Van der Hoorn S. Comparative quantification of health risks: conceptual framework and methodological issues. Popul Health Metr 2003; 1: 1.
-
Return to source text
Lim SS, Vos T, Flaxman AD, et al. A comparative risk assessment of burden of disease and injury attributable to 67 risk factors and risk factor clusters in 21 regions, 1990–2010: a systematic analysis for the Global Burden of Disease Study 2010. Lancet 2012; 380: 2224–60.
-
Return to source text
Forouzanfar MH, Alexander L, Anderson HR, et al. Global, regional, and national comparative risk assessment of 79 behavioural, environmental and occupational, and metabolic risks or clusters of risks in 188 countries, 1990–2013: a systematic analysis for the Global Burden of Disease Study 2013. Lancet 2015; 386: 2287–323.
-
Return to source text
Murray CJL, Ezzati M, Flaxman AD, et al. GBD 2010: design, definitions, and metrics.
Lancet 2012; 380: 2063–6.
-
Return to source text
Miller V, Singh GM, Onopa J, et al. Global Dietary Database 2017: data availability and gaps on 54 major foods, beverages and nutrients among 5.6 million children and adults from 1220 surveys worldwide. BMJ Glob Health 2021; 6: e003585.
-
Return to source text
Wang H, Abbas KM, Abbasifard M, et al. Global age-sex-specific fertility, mortality, healthy life expectancy (HALE), and population estimates in 204 countries and territories, 1950–2019: a comprehensive demographic analysis for the Global Burden of Disease Study 2019. Lancet 2020; 396: 1160–203.
-
Return to source text
NCD Risk Factor Collaboration (NCD-RisC). Trends in adult body-mass index in 200 countries from 1975 to 2014: a pooled analysis of 1698 population-based measurement studies with 19·2 million participants. Lancet 2016; 387: 1377–96.
-
Return to source text
Afshin A, Micha R, Khatibzadeh S, Mozaffarian D. Consumption of nuts and legumes and risk of incident ischemic heart disease, stroke, and diabetes: a systematic review and meta-analysis. Am J Clin Nutr 2014; ajcn.076901.
-
Return to source text
Aune D, Keum N, Giovannucci E, et al. Nut consumption and risk of cardiovascular disease, total cancer, all-cause and cause-specific mortality: a systematic review and dose-response meta-analysis of prospective studies. BMC Med 2016; 14: 207.
-
Return to source text
Aune D, Giovannucci E, Boffetta P, et al. Fruit and vegetable intake and the risk of cardiovascular disease, total cancer and all-cause mortality – a systematic review and dose-response meta-analysis of prospective studies. Int J Epidemiol 2016 (published online 18 March).
-
Return to source text
Schwingshackl L, Hoffmann G, Lampousi AM, et al. Food groups and risk of type 2 diabetes mellitus: a systematic review and meta-analysis of prospective studies. Eur J Epidemiol 2017; 32: 363–75.
-
Return to source text
Schwingshackl L, Schwedhelm C, Hoffmann G, et al. Food groups and risk of colorectal cancer. Int J Cancer 2018; 142: 1748–58.
-
Return to source text
Global BMI Mortality Collaboration. Body- mass index and all-cause mortality: individual-participant-data meta-analysis of 239 prospective studies in four continents. Lancet 2016; 388: 776–86.
-
Return to source text
Aune D, Keum N, Giovannucci E, et al. Whole grain consumption and risk of cardiovascular disease, cancer, and all cause and cause specific mortality: systematic review and dose-response meta-analysis of prospective studies. BMJ 2016; 353: i2716.
-
Return to source text
Imamura F, O’Connor L, Ye Z, et al. Consumption of sugar sweetened beverages, artificially sweetened beverages, and fruit juice and incidence of type 2 diabetes: systematic review, meta-analysis, and estimation of population attributable fraction. BMJ 2015; 351: h3576.
-
Return to source text
Xi B, Huang Y, Reilly KH, et al. Sugar-sweetened beverages and risk of hypertension and CVD: a dose-response meta-analysis. Br J Nutr 2015; 113: 709–17.
-
Return to source text
Xun P, Qin B, Song Y, et al. Fish consumption and risk of stroke and its subtypes: accumulative evidence from a meta-analysis of prospective cohort studies. Eur J Clin Nutr 2012; 66: 1199–207.
-
Return to source text
Zhao L-G, Sun J-W, Yang Y, Ma X, Wang Y-Y, Xiang Y-B. Fish consumption and all-cause mortality: a meta-analysis of cohort studies. Eur J Clin Nutr 2016; 70: 155–61.
-
Return to source text
Micha R, Shulkin ML, Peñalvo JL, et al. Etiologic effects and optimal intakes of foods and nutrients for risk of cardiovascular diseases and diabetes: systematic reviews and meta-analyses from the Nutrition and Chronic Diseases Expert Group (NutriCoDE). PLoS One 2017; 12: e0175149.
-
Return to source text
GBD 2017 Diet Collaborators. Health effects of dietary risks in 195 countries, 1990–2017: a systematic analysis for the Global Burden of Disease Study 2017. Lancet 2019; 0 (doi:10.1016/S0140-6736(19)30041-8).
-
Return to source text
Schwingshackl L, Knüppel S, Schwedhelm C, et al. Perspective: NutriGrade: a scoring system to assess and judge the meta-evidence of randomized controlled trials and cohort studies in nutrition research. Adv Nutr Int Rev J 2016; 7: 994–1004.
-
Return to source text
Bechthold A, Boeing H, Schwedhelm C, et al. Food groups and risk of coronary heart disease, stroke and heart failure: a systematic review and dose-response meta-analysis of prospective studies. Crit Rev Food Sci Nutr 2019; 59: 1071–90.
-
Return to source text
World Cancer Research Fund/American Institute for Cancer Research. Diet, Nutrition, Physical Activity and Cancer: A Global Perspective. Continuous Update Project Expert Report. 2018.
-
Return to source text
Aune D, Norat T, Romundstad P, Vatten LJ. Dairy products and the risk of type 2 diabetes: a systematic review and dose-response meta-analysis of cohort studies. Am J Clin Nutr 2013; 98: 1066–83.
-
Return to source text
Aune D, Lau R, Chan DSM, et al. Dairy products and colorectal cancer risk: a systematic review and meta-analysis of cohort studies. Ann Oncol Off J Eur Soc Med Oncol 2012; 23: 37–45.
-
Return to source text
Jayedi A, Shab-Bidar S, Eimeri S, Djafarian K. Fish consumption and risk of all-cause and cardiovascular mortality: a dose-response meta-analysis of prospective observational studies. Public Health Nutr 2018; 21: 1297–306.
-
Return to source text
Guasch-Ferré M, Satija A, Blondin SA, et al. Meta-analysis of randomized controlled trials of red meat consumption in comparison with various comparison diets on cardiovascular risk factors. Circulation 2019; 139: 1828–45.
-
Return to source text
Mohan D, Mente A, Dehghan M, et al. Associations of fish consumption with risk of cardiovascular disease and mortality among individuals with or without vascular disease from 58 countries. JAMA Intern Med 2021 (doi:10.1001/jamainternmed.2021.0036).
-
Return to source text
Springmann M, Clark M, Mason-D’Croz D, et al. Options for keeping the food system within environmental limits. Nature 2018; 562: 519–25.
-
Return to source text
Robinson S, Mason-D’Croz D, Islam S, et al. The International Model for Policy Analysis of Agricultural Commodities and Trade (IMPACT) – Model description for version 3. 2015.
-
Return to source text
Tubiello FN, Salvatore M, Cóndor Golec RD, et al. Agriculture, Forestry and Other Land Use Emissions by Sources and Removals by Sinks: 1990–2011 Analysis. FAO Statistical Division, 2014.
-
Return to source text
Carlson KM, Gerber JS, Mueller ND, et al. Greenhouse gas emissions intensity of global croplands. Nat Clim Change 2017; 7: 63–8.
-
Return to source text
Wollenberg E, Richards M, Smith P, et al. Reducing emissions from agriculture to meet the 2°C target. Glob Change Biol 2016 (doi:10.1111/gcb.13340).
-
Return to source text
GBD 2017 Risk Factor Collaborators. Global, regional, and national comparative risk assessment of 84 behavioural, environmental and occupational, and metabolic risks or clusters of risks for 195 countries and territories, 1990–2017: a systematic analysis for the Global Burden of Disease Study. Lancet 2018; 392: 1923–94.