Food systems and nutrition equity


- Imbalances in food systems are major drivers of dietary and nutrition inequities. They can restrict access to healthy diets or promote low-quality diets.
- There is a need for food systems to: go beyond a narrow focus on energy intake; reduce the dominance of cereal production (maize, rice and wheat); and increase the availability of healthy foods such as fruits and vegetables, nuts and whole grains.
- The food environment, where consumers make decisions about what to eat, is inequitable for many in terms of physical access, affordability, targeting of advertising, and marketing and quality of foods.
- The interconnected causes of inequities in food systems require an integrated response at global, national and local levels, bringing together the capacity of multiple sectors.
- An equity-sensitive approach to food systems that delivers healthy diets would seek to reduce inequities, as well as directly address food availability, accessibility and price in local food environments.
- Addressing inequities within food systems is ultimately about addressing power imbalances: amplifying the voice of those excluded, and holding the powerful to account.
"A food system gathers all the elements (environment, people, inputs, processes, infrastructures, institutions, etc.) and activities that relate to the production, processing, distribution, preparation and consumption of food, and the outputs of these activities, including socioeconomic and environmental outcomes."[1]
Components of the food system include food supply chains, food environments, consumer behaviour and external drivers (Figure 4.1). These components are interdependent and collectively influence diets and broader outcomes including nutrition and health.
With urbanisation, globalisation and trade liberalisation, food systems are changing rapidly. Food environments are globally connected; supply chains are longer and more complex. These changes have a dramatic impact on the nutritional status of populations. The way that people access food, the kinds of food they purchase, the methods of consumption and the culturally conditioned meanings of food and eating are also shaping food systems.
FIGURE 4.1 Food system framework
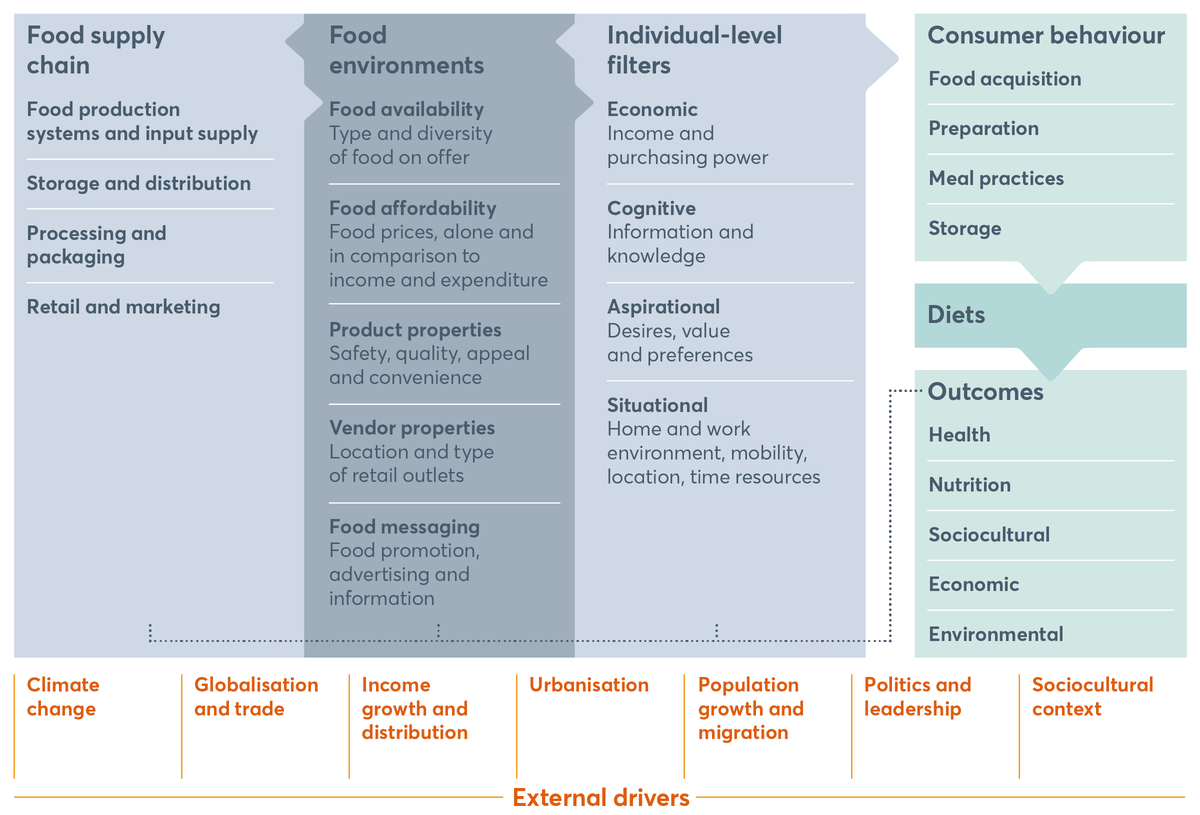
Food system framework
Source: Adapted from HLPE (2017), Nutrition and food systems. A report by the High Level Panel of Experts on Food Security and Nutrition of the Committee on World Food Security, Rome.
Food environments refer to the physical, economic, political and sociocultural contexts in which consumers engage with the food system to make their decisions about acquiring, preparing and consuming food. Food environments are the connecting link between supply systems and demand systems – they impact food supply chains and their functions, and the choice and quality of individual diets through a variety of factors. They determine: the types of food available at a given time, the physical access to these foods by the consumer, affordability, food promotion, advertising and information, and food quality and safety.
Inequitable processes affect each component of the food system, resulting in unequal outcomes ranging from poor availability and unaffordability to an overabundance of food of low nutritious quality and limited access to healthy foods. Inequities within food environments alone can be substantial for populations, given the crucial role of food environments as underlying determinants of nutrition outcomes (Figure 4.1). Addressing inequities within the food environment could mitigate impact on nutritional outcomes across food systems. The existing inequities in food systems restrict access to healthy diets for some people, leading to unequal nutrition outcomes and malnutrition in all its forms. The food environment, therefore, deserves a special focus. This chapter proposes a focus on inequities across food environments to highlight emerging solutions and propose concrete actions.
Food availability
Food availability refers to the type and diversity of food on offer, and is affected by food production systems.[2] Producing food to enable quality, diversity, safety and healthy diets requires consideration of issues such as: water and land access, food losses at farm gates, loss of biodiversity in species and varieties of food, and marginalised traditional or indigenous foods.[3] Global agriculture has largely focused on staple grains and seed oils, which is inconsistent with most national food-based dietary guidelines.[4] Such prioritisation creates inequities in production of non-staple food, and therefore an imbalance in availability.
Spotlight 4.1 shows that virtually all the increase in food energy (calories) from 1970 to 2010 is accounted for by non-staple crops, which are relatively more nutrient-dense. The proportion of calories from sugars and sweeteners has declined since 1970. This positive trend highlights the need for a more balanced policy and research and development focus on non-staple crops, to support producers to diversify. This in turn could improve the diversity of crops contributing to a balanced and healthy dietary composition.
Similarly, natural resources, ecosystems and climate change affect food production, and in turn the quality and quantity of food available to consumers. At the same time, consumer choices and demand influence the type of food produced and therefore potentially increase pressure on ecosystems and can contribute to climate change.
Figure 4.3 shows how animal-sourced foods have a significant impact on greenhouse gases. Production of staple grains (60% of which are used as animal fodder),[5] fruits and vegetables also creates environmental stress, as does intensive use of crop land and fresh water. Additionally, nitrogen and phosphorus fertiliser applications can affect the quality of food. Production and consumption practices affect many people living in low-income countries who do not have the resources to adapt fast enough to environmental changes and are limited in their options[6] for accessing healthy food. Between demand and supply, a well-regulated food environment – with specific attention to environmental impact, ecosystems management and effect on climate change – is an opportunity to ensure more equitable availability and accessibility of food for all, and to reduce inequality of nutrition outcomes.
Prabhu Pingali
There is a disconnect between agricultural policy and contemporary nutritional challenges. Agricultural policy has been slow to respond to the persistent problem of micronutrient malnutrition and child stunting, as well as the emerging challenges of overweight and obesity.[7] Agricultural policy is heavily biased towards improving staple-grain productivity, especially for the major staples of rice, wheat and maize, while dietary diversity needs are not adequately addressed. Figure 4.2 shows that total calorie consumption per person per day has risen over time, but the share of staple cereal calories within total calorie consumption has declined. The figure also shows that the absolute amount of staple cereal calories has declined since the 1990s.
FIGURE 4.2 Global average energy intake by food group, 1971–2013
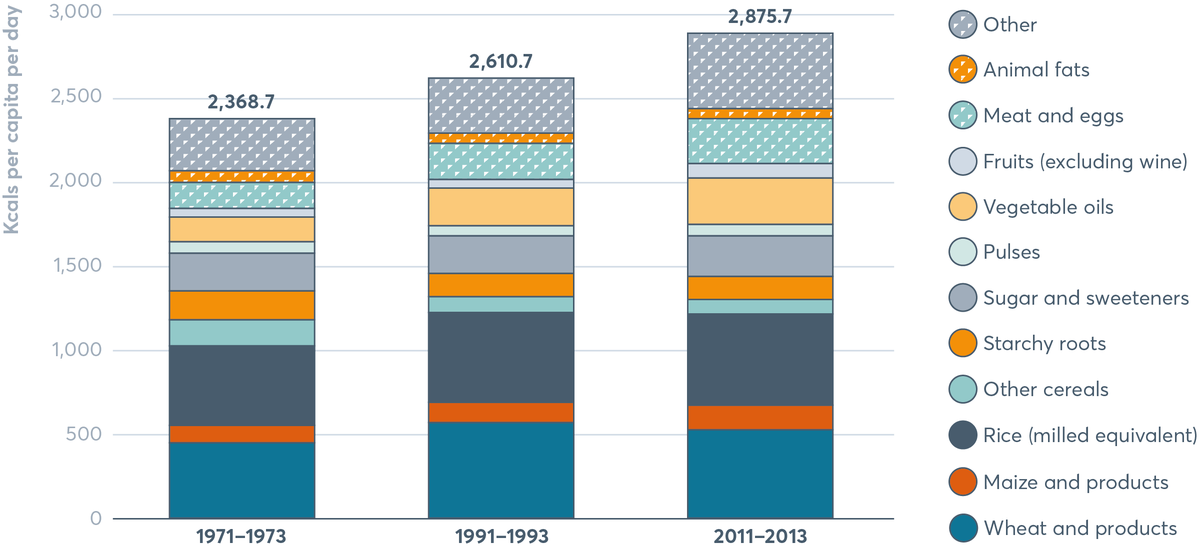
Between 1971−2013 wheat and products, and rice (milled equivalent) consecutively remained the highest average energy intake. While average energy intake of starchy roots has decreased, that of vegetable oils and fruits (excluding wines) has increased.
Source: Prabhu Pingali, 2015. Agricultural policy and nutrition outcomes – getting beyond the preoccupation with staple grains. Food Security, 7, pp. 583–91.
Donor funding for research and development has prioritised major staples at the cost of more nutritious crops and livestock. The Consortium of International Agricultural Research Centers (CGIAR),[8] for instance, has traditionally allocated most of its commodity research budget to the major staples, increasing this after the 2008 food price crisis.[9] The balance of funding has to be shared between fifteen crops, livestock, fish and trees. Research and development investments should prioritise neglected staples such as sorghum, millets and tropical tubers. Such investments could provide new opportunities for growth where agricultural conditions are not ideal. These opportunities would make the production of healthy food more attractive to producers and therefore improve the availability of more nutritious food, especially for the rural poor.[10]
Poorly developed market infrastructure and the large number of smallholders results in high transaction costs (arising from bargaining, managing, policing and arbitration) for integration into fresh food and livestock value chains. This has discouraged smallholders from diversifying their production systems. Given the demonstrated link between food production and dietary diversity, this affects dietary composition.[11] Investments in transport systems, cold chains (temperature controlled storage and transportation facilities) and improved connectivity allow for better functioning of markets for perishable products. Institutional interventions, such as producer organisations (formal rural organisations whose members organise themselves with the objective of improving farm income through improved production, marketing, and local processing activities) help to reduce transaction costs and form market linkages for small farms. A holistic view of agricultural policy would require governments to look beyond the major staples to ensure availability of and access to a wider and healthier basket of food.
FIGURE 4.3 Impacts of different food groups on the environment
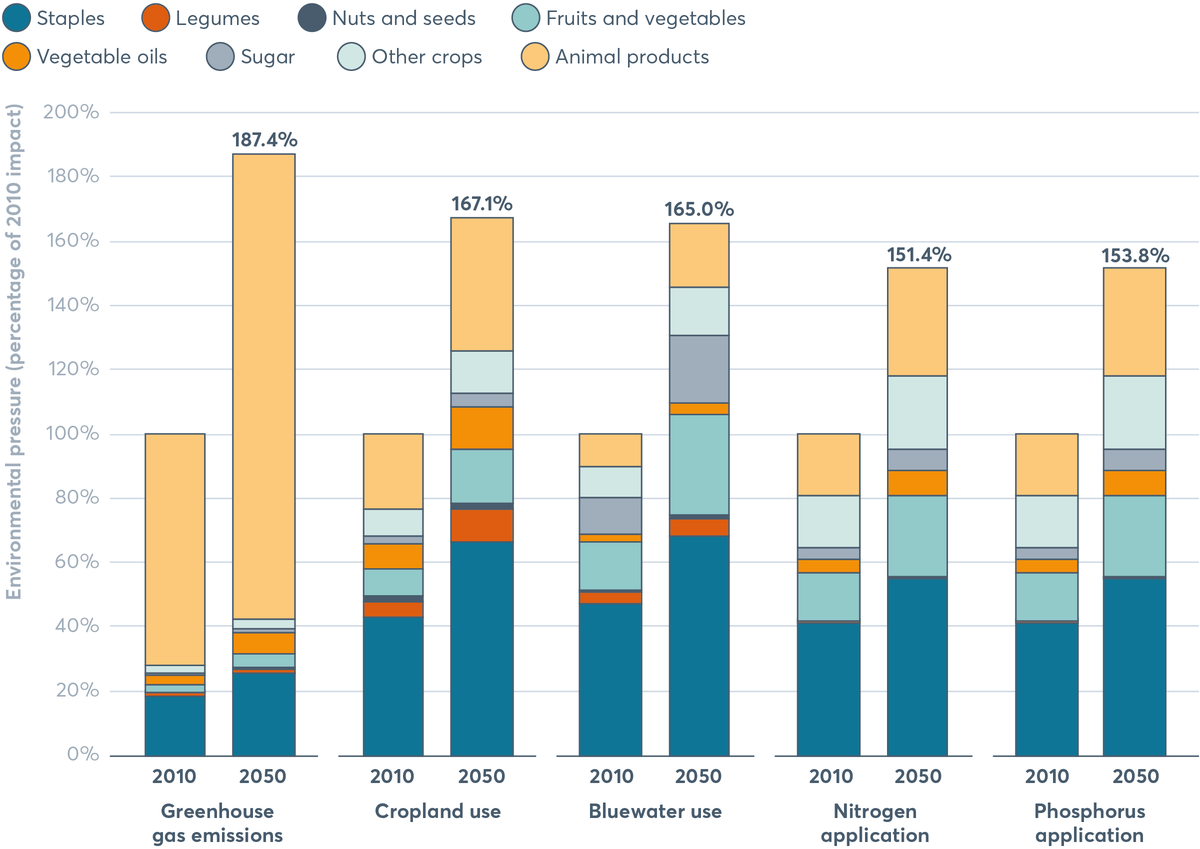
The impact of animal products on greenhouse gas emissions is set to double to 145 percent by 2050. The increase of staples on cropland is also set to grow from 43 percent to 66 percent by 2050.
Source: Springmann et al., 2018.[12]
Note: Bluewater = fresh water in streams, rivers, lakes and aquifers.
People’s physical access to diverse types of food in a given food environment depends on four types of food sources: production-based entitlement (growing food); trade-based entitlement (buying food); own-labour entitlement (working for food); inheritance and transfer entitlement (being given food by others).
Geographic conditions and lack of appropriate infrastructure can limit the availability and distribution of food. This is especially true for perishable foods, in low-income contexts and rural places where built living environments are often inadequate for ensuring healthy and safe food supplies. Critical factors that influence access include: mobility (distance to food entry points and available means of transportation); health; purchasing power and relative food prices; access to land of adequate size and quality, agricultural inputs, technology and services; time, facilities and equipment available for food preparation; knowledge and skills. The inequities in food accessibility for the rural, the poor and the geographically isolated result in limited access to sufficient quantities of healthy food.[13]
Inequitable provision of basic infrastructure such as housing, sanitation, energy and transport increases the vulnerability of populations to malnutrition. Where infrastructure is completely compromised, such as in conflict situations, breakdown of food availability and access can occur. In these contexts, it becomes incredibly difficult not only to access diverse and healthy foods but even to access sufficient quantities to ensure recommended calorie intakes.
Food affordability
For consumers to be able to purchase and consume healthy foods that are available within the food environment, such foods need to be affordable. For the most vulnerable groups of the population, nutrient-rich foods such as animal-source foods, fruits and vegetables are not affordable. Both price levels and volatility affect household purchasing power, welfare and food security, and nutrition.[14]
A healthy diet consists of fresh foods that are more perishable and subsequently require either cold chains or shorter-distance supply chains, as demonstrated in Spotlight 4.2. A lot of cheaply available food tends to be highly processed and unhealthy.[15] The affordability of healthy food is key to ensure a fair food environment for all. Increasing production and consumption of fresh foods locally, through targeted income support, nutritional assistance and agricultural development programmes, which encourage farmers to diversity the crops that they grow and foods that they consume, is a potential route to making healthy diets more affordable and accessible.
Derek Headey
Poor diets during pregnancy and in early childhood are a leading cause of undernutrition in early life, which manifest in compromised physical growth and brain development. But why are diets – including those of infants and young children – so inadequate in less developed countries?
A recent study suggests that the affordability of nutritious foods may be a more serious constraint than is commonly thought. For 657 foods in 176 countries, the study constructed ‘relative caloric prices’ (RCPs), which measure the cost of a given food calorie (e.g. egg calories) relative to the cost of a calorie from a staple food (e.g. rice). Conceptually, RCPs capture the cost of diversifying away from the starchy staples that poor people depend on. They also have the convenient property of being currency-free, making international comparisons relatively straightforward.
The authors found that nutrient-dense foods are often very expensive sources of calories relative to staples (Figure 4.4). Egg calories in Burkina Faso, for example, are around 15 times as expensive as calories from starchy staples like maize, rice and sorghum, whereas egg calories in the US are just 1.9 times as expensive as those from America’s main staples.[16] Throughout sub-Saharan Africa, eggs, fresh milk and fortified infant cereals are prohibitively expensive for the poor, though fish is relatively affordable in West and Central Africa. Dairy is quite cheap in India, while fish is relatively cheap in Southeast Asia.
A similar analysis for fresh fruits and vegetables shows that the situation with these foods is more nuanced. Green leafy vegetables are not dense in calories and are, therefore, expensive (given the large volume that has to be consumed to gain enough calories) almost everywhere. Vitamin-A-rich fruits and vegetables are typically quite expensive, but other fruits and vegetables can be moderately cheap, and legumes are a relatively cheap source of calories in most regions.[17]
The high cost of many nutrient-dense foods in populations most at risk of undernutrition is a major barrier to resolving undernutrition and warrants urgent policy attention. A key objective of pro-equity, nutrition-sensitive food policies should be to improve the affordability of nutrient-rich foods, both economy-wide and for the poorest households. At the level of a whole economy, this could be done by achieving lower prices through improved agricultural and trade policies. For the poorest households, affordability could be increased by targeted income support, nutritional assistance and agricultural development programmes that encourage diversification and consumption of home-produced foods. The critical importance of feeding nutrient-dense foods to infants and young children, and for pregnant and breastfeeding women, also justifies efforts to improve nutritional knowledge among both present and future care-givers.
FIGURE 4.4 Heat map of RCPs of animal-sourced foods in 176 countries, 2011
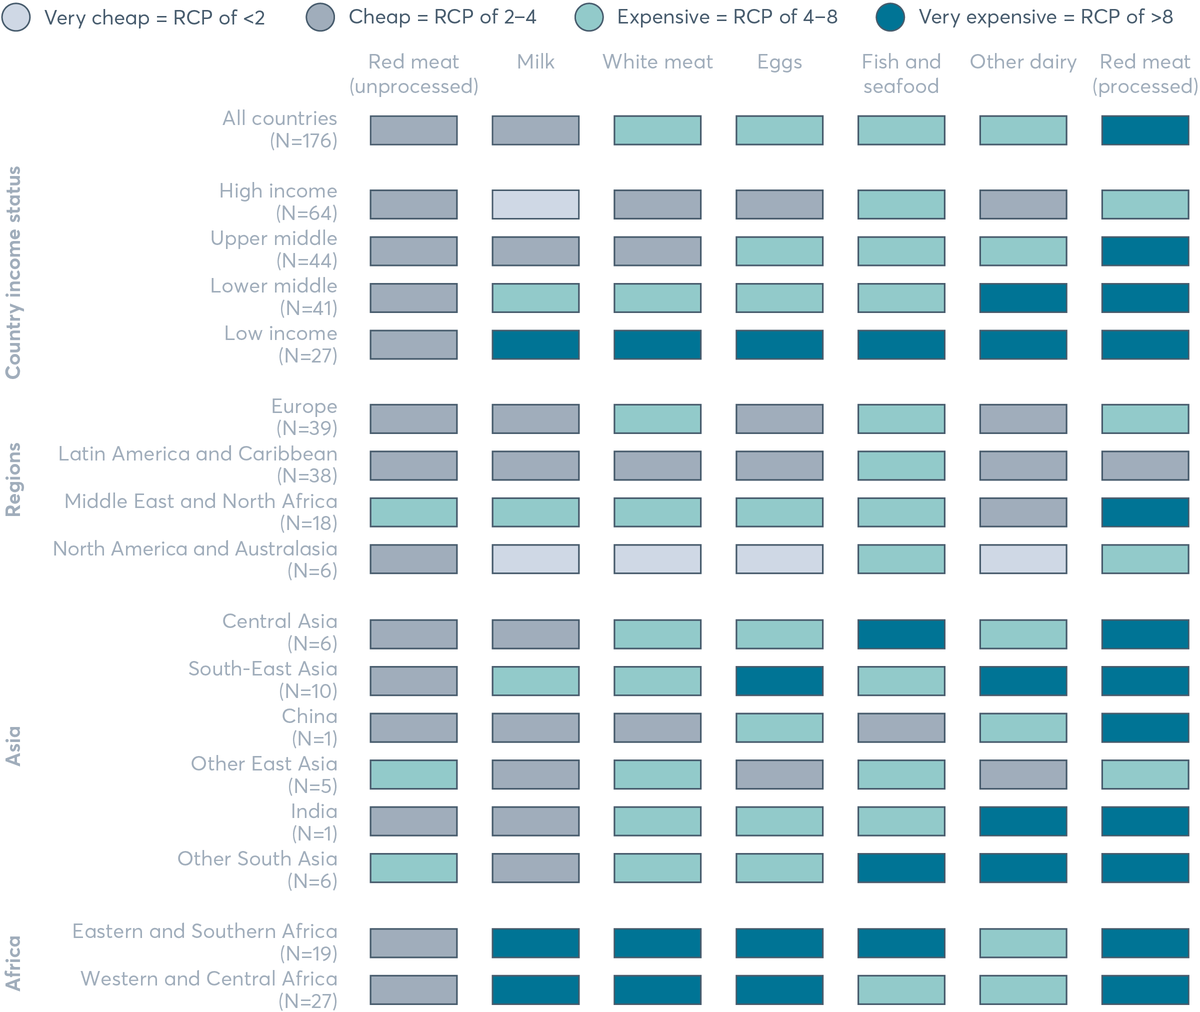
In low-income countries all sources of food except those from unprocessed red meat are considered very expensive, while in high-income countries only fish and sea food is considered expensive.
Source: Estimated from data described in Headey and Alderman, 2019.[18]
Note: The statistics reported are population-weighted means of the relative caloric prices (RCPs) for each income or regional group, grouped by World Bank income levels and major region, shaded according to the categories described in the legend.
Product and vendor properties
Product properties refer to the safety, quality and appeal of food available in the food environment. Vendor properties describe the location and type of a retail outlet. How people access, prepare and consume food is changing rapidly and depends on the food available to consumers. Packaged and processed foods now comprise a significant share of many diets around the world; and most of those foods are not aligned with the World Health Organization (WHO) definition of a healthy diet.[19] As noted in the previous Global Nutrition Report, Europe, North America and Oceania purchase the highest volumes of packaged foods, although sales growth is stagnant or declining. In contrast, Asia and Africa are undergoing significant growth in sales of packaged foods. Spotlight 4.3 shows the sales of processed foods and sugar-sweetened drinks by country-income category. Growth in sales of these foods and drinks is significant in middle- and low-income countries.
Phillip Baker, Priscila Machado, Kate Sievert, Kathryn Backholer, Colin Bell and Mark Lawrence
Processed foods, and especially ‘ultra-processed foods’ such as savoury snacks, processed meats, sugar-sweetened drinks, confectionery, frozen desserts, breakfast cereals and dairy products, now comprise a significant share of many diets around the world. They are widely available, cheap and intensively marketed. Such foods are often high in added sugars, trans fats and salt, as well as low in fibre and nutrient-density. They are the major contributor to dietary energy in many high-income countries and play an increasing role in the nutrition transition underway in countries undergoing rapid economic and social change.
Yet there is still relatively little data on the role of processed foods and sugary drinks in diets, especially in middle- and low-income countries (MICs and LICs), often because these categories are absent from health and dietary surveys. Instead, industry sales data is often used to shine a light on how purchasing these products is changing worldwide. Euromonitor International sales data reveals patterns in worldwide purchasing, and differences between countries at different stages of economic and social transition. Sales are increasing modestly or declining in many high-income countries (HICs) but growing quickly in upper-middle- and lower-middle-income countries (UMICs and LMICs).
There are notable differences between countries in the types of foods and drinks purchased. In HICs, a wider diversity of processed food types is purchased when compared to other regions. However there are large increases in purchases of processed and convenience foods such as savoury snacks, sweet biscuits, fruit snacks, baked goods, processed meat and meat substitutes. In UMICs, the ‘culinary food ingredient’ categories (vegetable oils, sauces, dressings and condiments) comprise a much greater share of purchases than in HICs (Figure 4.5).
Fizzy drinks make up the largest category of beverages consumed globally. However, sales in this category are sharply declining or stagnant in many HICs and UMICs, but growing strongly from a low baseline in LMICs and LICs. However, declines in the carbonates category in HICs have been offset by significant growth in non-carbonate categories – for example, sports and energy drinks, and the ready-to-drink coffee and tea categories (Figure 4.6).
FIGURE 4.5 Processed food sales by country-income level, 2003–2017 with projections to 2022
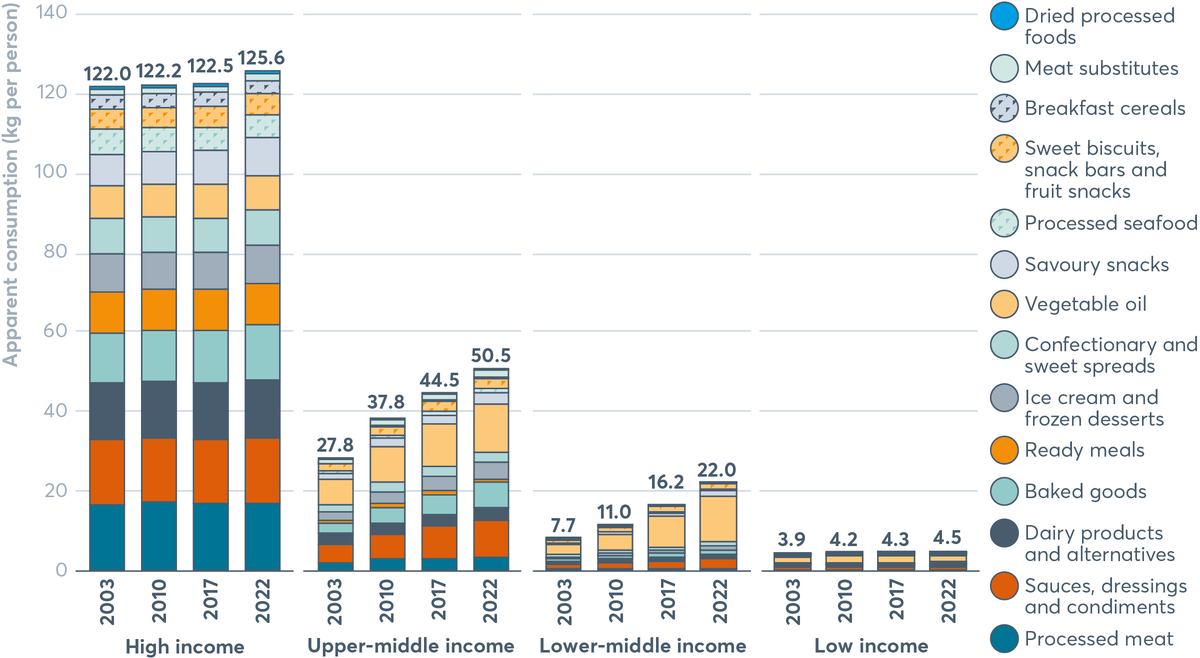
In kilograms per person, high-income countries sell more processed food than low-income countries. In both upper-middle-income countries and lower-middle-income countries there was an increase in processed food sales between 2003 and 2017 and this is set to continue into 2022.
Source: Data from Euromonitor International Market Information Database.[20]
Note: Data from Euromonitor Passport Market Information Database for 73 high-income countries, 55 upper-middle-income countries, 43 lower-middle-income countries, and 34 low-income countries.
FIGURE 4.6 Sales of non-alcoholic drinks by country-income level, 2003–2017 with projections to 2022
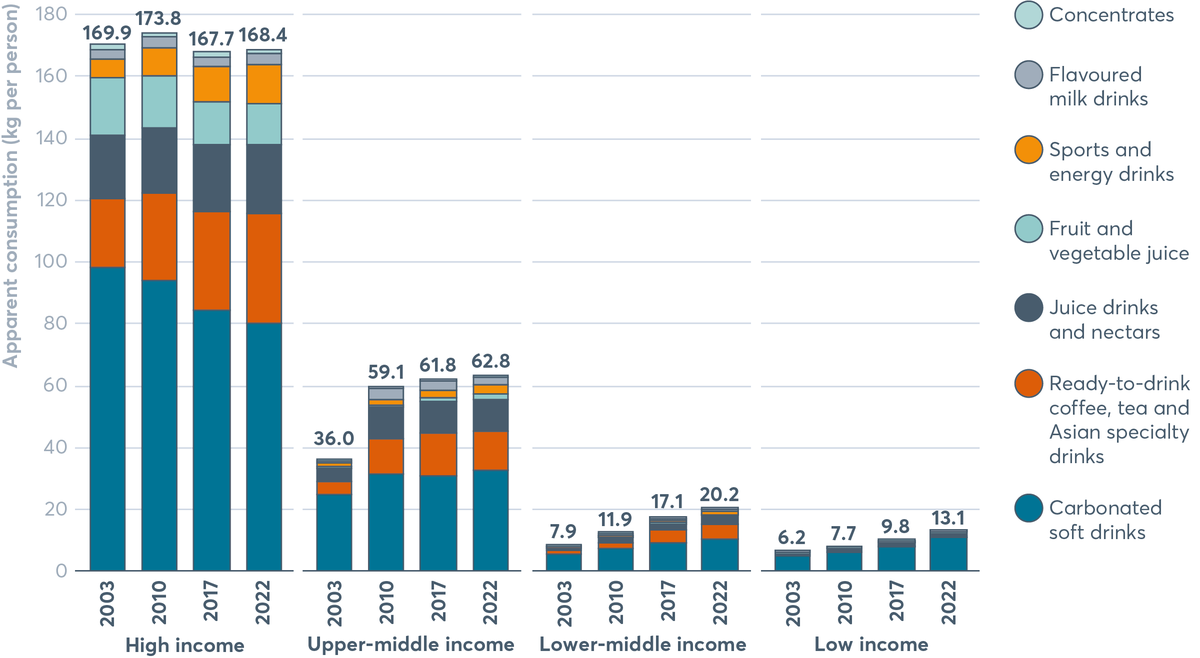
Lower-middle-income countries and low-income countries are slowly increasing their sales of non-alcoholic drinks. In low-income countries sales are predicated to rise from 6.2 kilograms per person in 2003 to 13.1 kilograms per person in 2022.
Source: Data from Euromonitor International Market Information Database.[21]
Note: Data from Euromonitor Passport Market Information Database for 73 high-income countries, 55 upper-middle-income countries, 43 lower-middle-income countries, and 34 low-income countries.
Full sources for this spotlight can be found in the notes.[22]
Kathrin M. Demmler and Matin Qaim
A recent study tried to address the question of whether the spread of supermarkets contributes to rising overweight and obesity, with data from Kenya,[23] one of the countries with the highest supermarket growth rates in Africa. The study focused on consumers in medium-sized towns. Around 500 households were randomly selected, and, in these households, socioeconomic and nutrition data was collected from male and female adults, first in 2012 and then again in 2015. In 2015, more detailed medical data was also collected.
Mean body mass index (BMI) and the proportion of adults being overweight or obese were found to be higher among those who bought some or all of their food in supermarkets than among those who used only traditional retailers (Figure 4.7). However, this simple comparison does not allow causal interpretation because supermarket users and non-users may also differ in terms of other factors. The analysis on shopping in supermarkets and obesity found that buying food in supermarkets instead of traditional markets is associated with an increased BMI of 0.64kg/m² on average. The estimates also suggest that using supermarkets is associated with a 7% higher probability of being overweight or obese (Figure 4.7).[24]
Rising rates of obesity are known to contribute to several non-communicable diseases (NCDs). Evaluating the medical data collected in 2015 reveals that buying food in supermarkets raises the likelihood of suffering from pre-diabetes (by 16%) and the metabolic syndrome (by 7%).[25]
These negative effects of supermarkets on adult nutrition and health can be attributed to the fact that the average price per calorie of food from supermarkets is lower than from traditional retailers. “Cheaper calories contribute to higher calorie consumption, which may improve food security for households that suffer from calorie undersupply”.[26] However, in urban areas of Kenya, adult overweight is now more prevalent than underweight. Also, supermarket users often consume more processed foods.
The study results suggest that supermarkets can influence dietary habits to a significant extent. Nevertheless, if properly managed, they could also have positive effects, such as making nutritious foods more accessible to poor consumers at affordable prices.
FIGURE 4.7 Supermarket users and non-users in Kenya: body mass index and overweight, 2012 and 2015
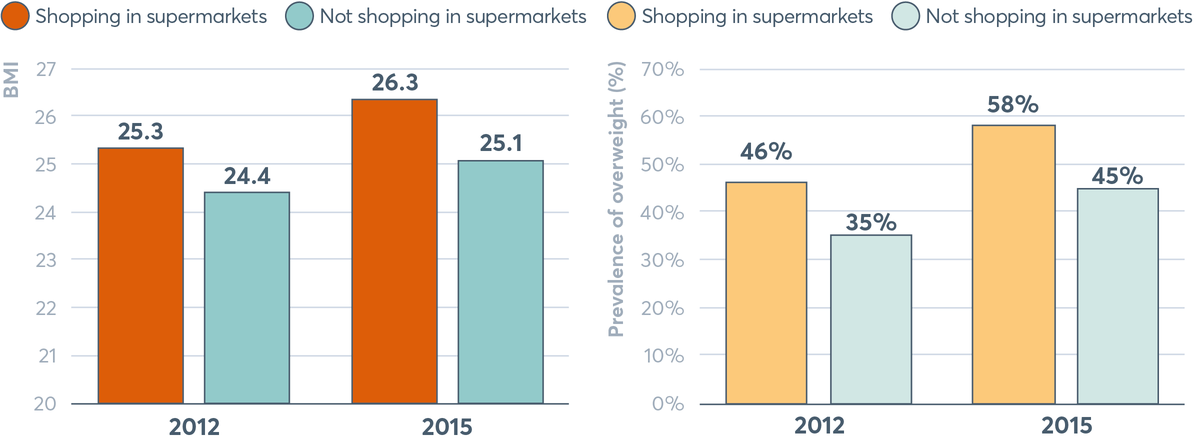
In both 2012 and 2015, those shopping in supermarkets were more likely to have a higher body mass index and a greater prevalence of being overweight.
Source: Demmler et al., 2018.
Notes: BMI = body mass index measured in kg/m²; overweight or obese = BMI>25kg/m².
Full sources for this spotlight can be found in the notes.[27]
The rapid spread of more formal supermarkets and fast-food chains influences consumer behaviour and food consumption patterns.[28] This expansion, while offering consumers a wider range of products, also entails major organisational changes in the whole food supply chain. There is growing evidence that this shift in food retailing is resulting in increased consumption of unhealthy foods. The informal sector within the food supply chain, however, continues to operate in parallel in several countries and is still an important mechanism in meeting food and nutrition needs. For example, in sub-Saharan Africa, informal traders meet the food needs of many poor urban households. However, the growth of supermarket chains is diminishing the role of this sector.[29] Spotlight 4.4 shows the impact of supermarkets on obesity in Africa and confirms that the retail environment affects people’s food choices and nutrition.[30] This is a cause for concern, and demands policy and planning responses in order to promote desirable nutrition outcomes.
The supermarket revolution also affects power relationships within food-supply chains.[31] The procurement processes of supermarkets and large processors are changing the rules of the game for farmers and first-stage processors.[32] Small farmers are particularly challenged to meet the requirements and standards of supermarket chains, their centralised procurement systems and large-scale agro-processors in terms of volume, cost, safety, quality and consistency. Food systems now need complex and multi-scale governance mechanisms, which should involve a range of actors across public and private sectors, as well as civil society, to tackle inequities.[33]
Food marketing and labelling
Information provided about food – and how food is promoted and advertised – influences consumer preferences, purchasing behaviour and consumption patterns, both negatively and positively.[34] Food promotion, for example, has a direct influence on preferences of children, adolescents and adults and their nutrition knowledge, diets and health. Advertising of ultra-processed food is more prevalent in low-income neighbourhoods, and marketing in these communities is increasing.[35] Spotlight 4.5 highlights inequities in food marketing to children by income and ethnic group.
Camila Corvalan and Fernanda Mediano
Malnutrition and unhealthy diets are known to be unequally distributed by income and ethnic group.[36] The marketing of foods and drinks high in fat, sugar and salt are believed to contribute to poor dietary behaviours particularly among children[37] resulting in diet-related diseases when they become adults.
Recent evidence shows that the marketing of unhealthy foods is targeted to specific groups, based on income and ethnicity, thereby contributing to increasing health disparities. Evidence from the United States (US) shows that African-Americans and Latinos are disproportionately exposed to outdoor advertisements for high-calorie, low-nutrient-dense foods and drinks, and sedentary entertainment and transportation, while being relatively underexposed to advertising for nutritious foods and drinks, and goods and services promoting physical activities.[38] Similar results have been recently reported concerning food marketing on US television.[39]
There is also some evidence that corporate marketing strategies vary depending on the economic status of the country. For example, analyses of corporate websites of the world’s three largest fast-food and drink companies showed that those companies promoted diet/healthier products more frequently in wealthier countries than in lower-income countries, while advertisement of their philanthropic activities was more frequent in lower-income countries.[40]
There is evidence that breast-milk substitutes are promoted and advertised in ways that contravene regulations, such as the International Code of Marketing of Breastmilk Substitutes,[41] in low- and middle-income countries of Africa and Asia, with a detrimental impact on compliance with recommended breastfeeding practices.[42]
Altogether, this evidence indicates that corporate marketing strategies have the potential to increase the burden of malnutrition in countries concerned. To restrict the disproportionate promotion of unhealthy foods and ensure healthier food environments that do not further worsen health disparities within and between countries, there is a need for stronger government regulatory efforts because self-regulatory campaigns have had limited impact.[43]
“The bulk of food and beverage advertisements derive from a small number of transnational companies; and […] that existing regulatory arrangements in countries do not appear to have created more favourable/healthy television food advertising environments compared with countries without any such policies.”[44] There is a need to regulate private sector marketing and advertising of foods and drinks, and to balance these with public measures including information campaigns to provide consumers with complete and unbiased information. Mass media public information campaigns have been consistently shown to be more successful in improving knowledge and attitudes among women, educated and higher socioeconomic status groups;[45] however they have not been consistently effective in improving diet and health outcomes. Interestingly, this could possibly deepen existing inequities and so calls for special efforts in information dissemination designed to reach all groups more equitably.[46]
Labelling of foods and the provision of declarations on food packaging are important tools to inform consumers, shape their preferences and influence industry behaviour by encouraging product reformulations. They are also useful for implementing and monitoring more consumer-oriented approaches such as front-of-pack labelling (FOPL), marketing restrictions, taxation/subsidies and school food policies. Yet the “use and understanding of the dominant standard in nutrition labelling – nutrition information panels – is significantly lower among lower income, lower literacy and ethnic minority groups.”[47] The use of interpretive FOPL (i.e. nutrition information with recommendations/judgements rather than specific facts) is recommended in addition to the mandatory nutrition declaration, as these can be more easily understood by consumers of different literacy levels.
FOPL can follow a nutrient-specific system (such as Chile’s black label) or a summary indicator system (such as the UK’s ‘traffic lights’) but they should signal unhealthiness to guide consumers’ choices to more nutritious options.[48] However, while presenting advantages, mandatory labelling can be a barrier for small-scale producers and processors to entering or remaining in markets.
In addition to collecting more and better food-environment data, we need to understand what people are eating and how they make food choices. This is necessary for developing food and nutrition policies, including dietary guidelines. Comprehensive information on diets, food sourcing and costs is needed, therefore, but has been difficult to obtain. Such data is now becoming available, with better use of metrics and surveys that feed into larger databases. Case studies are also providing important insights. Despite these improvements, there are still large gaps in knowledge at the national level, particularly in low-income settings.
Most research on food environments stems from high-income countries and focuses mainly on obesity and non-communicable diseases. Although, as mentioned in the 2018 Global Nutrition Report, initiatives such as INFORMAS[49] are used by some LMICs, there is very little information available – not only on the low-income context but on rural food environments and for those in conflict or protracted-crisis situations. In addition to societal inequities that constrain data collection and analysis, challenges arise from within the research framework, beginning with the lack of consensus on defining the food environment and standardised metrics and tools, as outlined in Spotlight 4.6.
Bianca Carducci, Christina Oh and Zulfiqar A. Bhutta
There is mounting global literature on the relationship between the food environment and public health. This is particularly so around the effective prevention of non-communicable diseases (NCDs) and prevention and management strategies concerning the food environment, including food policy, promotion and marketing. However, there are gaps in evidence to inform the development of appropriate interventions, especially within the context of LICs and LMICs. Additionally, consensus on the definition, purpose and depth of the ‘food environment’ is required to streamline future research.
There is also considerable diversity of opinion on standardised metrics and tools to measure the food environment. Unlike high-income countries where formal channels to acquire food allow for convenient measurement, LMIC food retail environments are dynamic, unregulated and possess a large proportion of informal food vendors. This results in enormous variety in metrics in terms of reference points (i.e. food accessibility), media coverage (i.e. food promotion) and level of implementation (i.e. policies). Moreover, tools to measure the food environment are limited to labour-intensive data collection processes in LMICs, compared to the use of global positioning systems, geographical information systems, remote sensing and satellite imagery in richer countries. Similarly, other dimensions of the food environment, such as food safety and food quality, are often difficult to measure in an LMIC setting due to poor government regulation and compliance, as well as instability.
The household food environment is a critical space for food purchasing decisions, food preparation and, ultimately, development of food attitudes, knowledge, preferences and behaviours. However, little is known about appropriate effective measures at this level. A consensus on valid and reliable metrics and tools in an LMIC context is urgently needed to assess the impact on health outcomes.
Within food-environment literature, there is a need for better representation of participants from low- and lower-middle-income countries and of those from rural settings to discern demographic-specific health needs. Finally, there are various empirical research gaps relating to data analysis, including adjustment for confounding variables and poor disaggregation of data, for example, by income level, gender and age.
In summary, investment in food-environment research, with consideration of key knowledge gaps, is necessary to address the evolving nutrition transition and the rising double burden of malnutrition in LMICs.[50] This is in addition to the promotion of publicly available data repositories, including big data and commercial databases.
While many societal inequities permeate food systems, there is a unique set of factors concerning power imbalances across food systems. These imbalances arise from the influence of agribusiness, food and drink industries, international development policymakers and donors. Such groups influence how governments structure their food systems and environments, and also affect the poorest marginalised consumers, who are excluded from this process. All these factors shape the types of foods people have access to on a daily basis. There is an “implicit tension between government action to promote food security and economic growth by encouraging investment, and government action to reduce the consumption of highly processed foods to prevent diet-related NCDs”.[51]
“In the context of a rights-based approach, those most impacted by inequitable, dysfunctional food systems and unhealthy food environments include low-income consumers, the rural and urban poor, smallholder and subsistence farmers […] indigenous people”,[52] small-scale retailers, processors and distributors.
Addressing dietary and nutrition inequities is about improving the distribution of opportunities to live a healthy and fulfilling life. Governments and other food-system actors generally favour interventions focused on individual-level efforts.[53] While direct action can help, it is important also to consider the underlying unequal distribution of factors that support the opportunity to eat a healthy diet[54] (see Figure 1.1). Unless this oversight is addressed, dietary and nutrition inequities will persist and possibly increase. Food choice is not a simply personal decision: food and diets are shaped by context and driven by deep, often unseen, systemic and social factors. New decision-making and accountability mechanisms are needed to address the uneven power dynamics.
Approaches that require a lower level of personal agency are both more effective and equitable for all.[55] Beyond focusing on a few interventions that adjust small and specific elements of food systems, there is a need to broaden efforts to change system-wide drivers of poor nutrition suggested by recent reports, including: the EAT-Lancet Commission on Food, Planet, Health;[56] The Lancet Commission on The Global Syndemic of Obesity, Undernutrition and Climate Change;[57] and the Double Burden of Malnutrition Lancet Series.[58]
An equity-focused approach to food systems that deliver healthy diets would therefore ideally consider actions that seek to reduce inequities in the immediate conditions in which people are born, live, work and play. It would also directly address food availability, accessibility and price in local food environments.[59]
“Policymakers need to create strong regulatory and fiscal frameworks [free from conflict of interest] that provide guidance to those who produce the diets from our food systems.”[60]
“Trade and subsidy policies need to align better with those that promote healthy diets”.[61] Voluntary self-regulation efforts by the corporate sector are patchy and inadequate: while some in the food and drink industry are acting in ways that benefit public health, their efforts alone are not enough. Box 4.1 outlines some of the positive actions and collaborations in the food and drink sector to support good health and nutrition. Social movements and civil society organisations can act to rebalance power across the food system, towards healthy systems in the public interest of those whose voices go unheard.
The private food and drink sector has a responsibility both to promote healthy eating and to prevent unhealthy diets under human rights principles. The sector must act following established codes of conduct; governments and civil society should hold organisations accountable to their commitments. There are ways in which commercial goals can work for the public good as well. An example is the Scaling Up Nutrition (SUN) Business Network (SBN),[62] established in 2015 as the business arm of the SUN Movement. The SUN Business Network Indonesia has identified five key areas through which the private sector can contribute to improved nutrition:
- Agriculture and nutrition, providing investment in technological innovations
- Large-scale food fortification, adding essential vitamins to staples and condiments
- Increasing availability of specially formulated foods for target groups
- Workforce nutrition programmes, educating employees about the importance of nutritious foods
- Supporting nutrition-sensitive interventions, to strengthen underlying health systems.[63]
Through these approaches, food companies can help to make nutritious foods more accessible to consumers, which in turn can significantly improve diets and health. The actions should include transparent labelling, reducing sugar, salt and fat content in their products, and fortifying their products with essential nutrients.[64] Governments are also imposing regulations to compel businesses to do more. For example, Denmark has introduced a ban on products containing trans fats, while South Africa was the first country to legislate maximum salt levels in foods.[65] Food companies can also work with the nutrition community to improve the nutritional quality of their products.
Some emerging solutions
- Optimisation of farm subsidies and increased public investment for producing healthier agricultural and food products. For example, one option is increased research spending on biofortified crops and livestock, another is reduced subsidies for staple foods but increased support for healthier vegetables, fruits, nuts and fish.
- Support for public transport schemes and shorter supply chains for fresh-food delivery programmes, to improve access to healthy food among disadvantaged groups and reduce inequities in diets.
- Development of policies to encourage healthy food outlets and improve physical access to foods, especially in low- and middle-income countries, as these countries urbanise. Such policies need to include actors in the informal food sector.
- Cash transfers to increase the affordability of foods and drive food-system change. However, these need to be promoted with complementary policy measures, a well-defined set of policy goals and rigorous evaluation.[66]
- Use of fiscal instruments (like taxes on sugar-sweetened beverages and unhealthy foods) and regulatory mechanisms (such as bans) to support healthier diets and hold the food industry accountable. Depending on the type of food system and the national and local context, taxes and subsidies may influence food choices and intakes.
- Limiting advertising of ultra-processed food, creating food-based dietary guidelines, improving labelling and regulating health claims on packaged foods to create an equitable food environment where consumers can make informed choices without being misled.
- Development of policies and investments to diversify food production away from the staple food cereals and towards more diversified non-staple crop production, and to improve value chains to increase incomes of small-scale farmers.
A range of different strategies and interventions is necessary to shift to healthier, environmentally sustainable and more equitable diets for all. Interventions targeting food environments should be included along with agricultural and food-supply approaches. This will require coordination of global, national and local actions through multiple sectors such as agriculture, health and transport. All stakeholders, including governments, industry, consumers and civil society, must act through different entry points of the food system.
- Governments need to create strong regulatory and policy frameworks, and fiscal instruments, to support healthier diets. Governments should also set up adequate monitoring and accountability systems to ensure compliance.
- The food and drink industry should comply with international and national codes of conduct, including health and nutrition benefits to society and environmental protection and improvement.
- Civil society should actively identify, define and recommend evidence-based policies to promote healthy, sustainable and equitable food systems and should hold the government and the food industry accountable for their actions.
- International agencies in collaboration with all stakeholders (including donors) should promote, monitor and track progress to achieve healthy, sustainable and equitable food systems globally.
Photo: Roger Wheatley, AusAID
Share Food systems and nutrition equity
Downloads
- English Chapter 4_2020 Global Nutrition Report (PDF 996.0kB) 2020 Global Nutrition Report (PDF 6.9MB) Launch presentation_2020 Global Nutrition Report (PDF 4.4MB)
- French Chapitre 4 2020 Rapport sur la Nutrition Mondiale (PDF 1.1MB) 2020 Global Nutrition Report (PDF 15.6MB)
- Spanish Capítulo 4_2020 Informe de la Nutricion Mundial (PDF 1.1MB) 2020 Global Nutrition Report (PDF 14.8MB)
Data downloads
Download the 2020 Global Nutrition Report
Download the reportFootnotes
-
Return to source text
HLPE, 2017. Nutrition and food systems. A report by the High Level Panel of Experts on Food Security and Nutrition of the Committee on World Food Security, Rome.
-
Return to source text
HLPE, 2017. Nutrition and food systems. A report by the High Level Panel of Experts on Food Security and Nutrition of the Committee on World Food Security, Rome.
-
Return to source text
HLPE, 2017. Nutrition and food systems. A report by the High Level Panel of Experts on Food Security and Nutrition of the Committee on World Food Security, Rome.
-
Return to source text
Herforth et al., 2019. A Global Review of Food-Based Dietary Guidelines. Advances in Nutrition, 10(4), pp. 590–605, DOI: 10.1093/advances/nmy130.
-
Return to source text
Pingali P., 2015. Agricultural policy and nutrition outcomes – getting beyond the preoccupation with staple grains. Food Security, 7, pp. 583–91, DOI: 10.1007/s12571-015-0461-x.
-
Return to source text
Fanzo J. et al., 2017. Climate change and variability: what are the risks for nutrition, diets, and food systems? IFPRI Discussion Paper, 01645.
-
Return to source text
Pingali P., 2015. Agricultural policy and nutrition outcomes – getting beyond the preoccupation with staple grains. Food Security, 7, pp. 583–91, DOI: 10.1007/s12571-015-0461-x.
-
Return to source text
www.cgiar.org (accessed 2 March 2020)
-
Return to source text
Pingali P., 2015. Agricultural policy and nutrition outcomes – getting beyond the preoccupation with staple grains. Food Security, 7, pp. 583–91, DOI: 10.1007/s12571-015-0461-x.
-
Return to source text
Pingali P. and Sunder N., 2017. Transitioning toward nutrition sensitive food systems in developing countries. Annual Review of Resource Economics, 9, pp. 439–59.
-
Return to source text
“Agriculture and food production systems affect food availability and affordability as well as dietary quality and diversity.” HLPE, 2017. Nutrition and food systems. A report by the High Level Panel of Experts on Food Security and Nutrition of the Committee on World Food Security, Rome.
-
Return to source text
Springmann M., Clark M., Mason-D’Croz D. et al., 2018. Options for keeping the food system within environmental limits. Nature, 562(7728), p. 520, DOI: 10.1038/s41586-018-0594-0.
-
Return to source text
Richardson A.S., Boone-Heinonen J., Popkin B.M. et al., 2012. Are neighbourhood food resources distributed inequitably by income and race in the USA? Epidemiological findings across the urban spectrum, BMJ Open, 2, e000698, DOI: 10.1136/bmjopen-2011-000698; Azétsop J. and Joy T.R., 2013. Access to nutritious food, socioeconomic individualism and public health ethics in the USA: a common good approach; Philosophy, Ethics, and Humanities in Medicine, 8(16), DOI: 10.1186/1747-5341-8-16.
-
Return to source text
See the Pietermaritzburg Economic Justice & Dignity Group Household affordability Index, December 2019. Available at: https://pmbejd.org.za/index.php/advocacy
-
Return to source text
Friel S. and Baker P.I., 2009. Equity, food security and health equity in the Asia Pacific region. Asia Pacific Journal of Clinical Nutrition, 18(4), pp. 620–32.
-
Return to source text
Headey D. and Alderman H., 2019. The relative caloric prices of healthy and unhealthy foods differ systematically across income levels and continents. International Food Policy Research Institute. Figure 1, p. 2024. Available at https://academic.oup.com/jn/article-abstract/149/11/2020/5535433
-
Return to source text
2018 Global Nutrition Report: Shining a light to spur action on nutrition. Development Initiatives.
-
Return to source text
This figure was prepared by Phillip Baker using data sourced from Euromonitor through an institutional licence at Deakin University.
-
Return to source text
This figure was prepared by Phillip Baker using data sourced from Euromonitor through an institutional licence at Deakin University.
-
Return to source text
Monteiro C.A., Moubarac J.C., Cannon G. et al., 2013. Ultra-processed products are becoming dominant in the global food system. Obesity Reviews, 14, pp. 21–28; Poti J.M., Mendez M.A., Ng S.W. et al., 2015. Is the degree of food processing and convenience linked with the nutritional quality of foods purchased by US households? American Journal of Clinical Nutrition, 101(6), pp. 1251–62; Monteiro C.A., Levy R.B., Claro R.M. et al., 2011. Increasing consumption of ultra-processed foods and likely impact on human health: evidence from Brazil. Public Health Nutrition, 14(1), pp. 5–13; Popkin B.M., 2006. Global nutrition dynamics: the world is shifting rapidly toward a diet linked with noncommunicable diseases. American Journal of Clinical Nutrition, 84(2), pp. 289–98; Popkin B.M., Adair L.S. and Ng S.W., 2012. Global nutrition transition: the pandemic of obesity in developing countries. Nutrition Reviews, 70(1), pp. 3–21; GPAFSM (Global Panel on Agriculture and Food Systems for Nutrition), 2016. Food systems and diets: facing the challenges of the 21st Century. London; Baker P. and Friel S., 2014. Processed foods and the nutrition transition: evidence from Asia. Obesity Reviews, 15(7), pp. 564–77; Louzada M.L.D.C., Ricardo C.Z., Steele E.M. et al., 2018. The share of ultra-processed foods determines the overall nutritional quality of diets in Brazil. Public Health Nutrition, 21(1), pp. 94–102; Chen Y.C., Huang Y.C., Lo Y.C. et al., 2018. Secular trend towards ultra-processed food consumption and expenditure compromises dietary quality among Taiwanese adolescents. Food & Nutrition Research, 62; Martínez Steele E., Popkin B.M., Swinburn B. et al., 2017. The share of ultra-processed foods and the overall nutritional quality of diets in the US: evidence from a nationally representative cross-sectional study. Population Health Metrics, 15(1), p. 6; Moubarac J.C., Batal M., Louzada M.L. et al., 2017. Consumption of ultra-processed foods predicts diet quality in Canada. Appetite,108, pp.512–20: Rauber F., da Costa Louzada M..L, Steele E.M. et al., 2018. Ultra-processed food consumption and chronic non-communicable diseases-related dietary nutrient profile in the UK (2008–2014). Nutrients,10(5); Schnabel L., Kesse-Guyot E., Allès B. et al., 2019. Association between ultraprocessed food consumption and risk of mortality among middle-aged adults in France. JAMA Internal Medicine; Rico-Campà A., Martínez-González M.A., Alvarez-Alvarez I. et al., 2019. Association between consumption of ultra-processed foods and all cause mortality: SUN prospective cohort study. BMJ, DOI: 365:l1949; Juul F., Martinez-Steele E., Parekh N. et al., 2018. Ultra-processed food consumption and excess weight among US adults. British Journal of Nutrition, 120(1), pp. 90–100; Louzada M.L., Baraldi L.G., Steele E.M. et al., 2015. Consumption of ultra-processed foods and obesity in Brazilian adolescents and adults. Preventative Medicine, 81, pp. 9–15; Mendonça R.D., Pimenta A.M., Gea A. et al., 2016. Ultraprocessed food consumption and risk of overweight and obesity: the University of Navarra follow-up (SUN) cohort study. The American Journal of Clinical Nutrition, 104(5), pp. 1433–40; Nardocci M., Leclerc B.S., Louzada M.L. et al., 2018. Consumption of ultra-processed foods and obesity in Canada. Canadian Journal of Public Health; Mendonça R.D., Lopes A.C., Pimenta A.M. et al., 2017. Ultra-processed food consumption and the incidence of hypertension in a Mediterranean cohort: the Seguimiento Universidad de Navarra project. American Journal of Hypertension, 30(4), pp. 358–66; Rauber F., Campagnolo P.D., Hoffman D.J. et al., 2015. Consumption of ultra-processed food products and its effects on children’s lipid profiles: a longitudinal study. Nutrition, Metabolism & Cardiovascular Diseases, 25(1), pp. 116–22; Srour B., Fezeu L.K., Kesse-Guyot E. et al., 2019. Ultra-processed food intake and risk of cardiovascular disease: prospective cohort study (NutriNet-Santé). BMJ, DOI: 365:l1451; Fiolet T., Srour B., Sellem L. et al., 2018. Consumption of ultra-processed foods and cancer risk: results from NutriNet-Santé prospective cohort. BMJ, DOI : 360:k322; Schnabel L., Buscail C., Sabate J.M. et al., 2018. Association between ultra-processed food consumption and functional gastrointestinal disorders: results From the French NutriNet-Santé cohort. The American Journal of Gastroenterology; Melo B., Rezende L., Machado P. et al., 2018. Associations of ultra-processed food and drink products with asthma and wheezing among Brazilian adolescents. Pediatric Allergy and Immunology.
-
Return to source text
Reardon T. et al., 2003. The rise of supermarkets in Africa, Asia, and Latin America. American Journal of Agricultural Economics 85(5), pp. 1140–46; Timmer C.P., 2009. Do supermarkets change the food policy agenda? World Development 37(11), pp. 1812–19.
-
Return to source text
Battersby J. and Watson V., 2018. Addressing food security in African cities. Nature Sustainability, 1, pp. 153–55, DOI: 10.1038/s41893-018-0051-y
-
Return to source text
Demmler K.M., Ecke O. and Qaim M., 2018. Supermarket shopping and nutritional outcomes: a panel data analysis for urban Kenya. World Development, 102, pp. 292–303.
-
Return to source text
Reardon T. and Timmer C.P., 2008. The rise of supermarkets in the global food system, in Von Braun J. and Diaz-Bonilla E., eds, Globalization of food and agriculture and the poor, Oxford University Press, Oxford, UK, p. 189; Lang T. and Barling D., 2012. Food security and food sustainability: reformulating the debate. The Geographical Journal, 178(4), pp. 313–26, available at www.jstor.org/stable/23360870.
-
Return to source text
Reardon T., Timmer C.P., Barrett C.B. and Berdegué J., 2003. The rise of supermarkets in Africa, Asia, and Latin America. American Journal of Agricultural Economics, 85(5), pp. 1140–46.
-
Return to source text
Lang T. et al., 2009. Food policy: integrating health, environment and society. Oxford University Press, Oxford, UK; Biénabe E., Rival A. and Loeillet D., eds. 2017. Sustainable development and tropical agri-chains. Springer, Dordrecht.
-
Return to source text
Demmler K.M., Ecker, O. and Qaim M., 2018. Supermarket shopping and nutritional outcomes: a panel data analysis for urban Kenya. World Development 102, pp. 292–303.
-
Return to source text
Demmler K.M., Ecker, O. and Qaim M., 2018. Supermarket shopping and nutritional outcomes: a panel data analysis for urban Kenya. World Development 102, pp. 292–303.
-
Return to source text
Demmler K.M., Klasen S., Nzuma J.M. and Qaim, M., 2017. Supermarket purchase contributes to nutrition-related non-communicable diseases in urban Kenya. PLoS One, 12(9).
-
Return to source text
Qaim M., 2019. How ‘supermarketisation’ affects nutrition and health in Kenya. Rural 21, The International Journal for Rural Development, 53(2).
-
Return to source text
Demmler K.M., Ecke O. and Qaim M., 2018. Supermarket shopping and nutritional outcomes: a panel data analysis for urban Kenya. World Development, 102, pp. 292–303; Demmler K.M., Klasen S., Nzuma J.M. et al., 2017. Supermarket purchase contributes to nutrition-related non-communicable diseases in urban Kenya. PLoS One, 12, e0185148; Qaim M., 2019. How ‘supermarketisation’ affects nutrition and health in Kenya. Rural 21, The International Journal for Rural Development, 53(2).
-
Return to source text
HLPE, 2017. Nutrition and food systems. A report by the High Level Panel of Experts on Food Security and Nutrition of the Committee on World Food Security, Rome, p. 30.
-
Return to source text
Stuckler D., McKee M., Ebrahim S. et al., 2012. Manufacturing epidemics: the role of global producers in increased consumption of unhealthy commodities including processed foods, alcohol, and tobacco. PLoS Med, 9(6), e1001235, DOI: 10.1371/journal.pmed.1001235
-
Return to source text
2018 Global Nutrition Report: Shining a light to spur action on nutrition. Development Initiatives, p. 50.
-
Return to source text
Sadeghirad B., Duhaney T., Motaghipisheh S. et al., 2016. Influence of unhealthy food and beverage marketing on children’s dietary intake and preference: a systematic review and meta-analysis of randomized trials. Obesity Reviews, 17(10), pp. 945–59; Boyland E.J. et al., 2016. Advertising as a cue to consume: a systematic review and meta-analysis of the effects of acute exposure to unhealthy food and non-alcoholic beverage advertising on intake in children and adults. The American Journal of Clinical Nutrition, 103(2), pp. 519–33.
-
Return to source text
Yancey A.K. et al., 2009. A cross-sectional prevalence study of ethnically targeted and general audience outdoor obesity-related advertising. The Milbank Quarterly, 87(1), pp. 155–84, DOI: 10.1111/j.1468-0009.2009.00551.x
-
Return to source text
Harris J.L., Frazier III, W., Kumanyika S. and Ramirez A.G., 2019. Increasing disparities in unhealthy food advertising targeted to Hispanic and Black youth. Rudd Center for Food Policy & Obesity, University of Connecticut.
-
Return to source text
Bragg M.A., Eby M., Arshonsky J.et al., 2017. Comparison of online marketing techniques on food and beverage companies’ websites in six countries. Global Health, 13(1), p. 79, DOI: 10.1186/s12992-017-0303-z
-
Return to source text
WHO, 1981. International Code of Marketing of Breast-milk Substitutes. Geneva: WHO.
-
Return to source text
Pereira C., Ford R., Feeley A.B. et al., 2016. Cross-sectional survey shows that follow-up formula and growingup milks are labelled similarly to infant formula in four low and middle income countries. Maternal and Child Nutrition, 12(S2), pp. 91–105, DOI: 10.1111/mcn.12269; Champeny M., Pereira C., Sweet L. et al., 2016. Cross-sectional survey shows that follow-up formula and growing-up milks are labelled similarly to infant formula in four low and middle income countries. Maternal and Child Nutrition, 12(S2), pp. 126–39, DOI: 10.1111/mcn.12272; Piwoz E.G. and Huffman S.L., 2015. The Impact of Marketing of Breast-Milk Substitutes on WHO-Recommended Breastfeeding Practices. Food and Nutrition Bulletin, 36(4), pp. 373–86, DOI: 10.1177/0379572115602174.
-
Return to source text
Vergeer L., Vanderlee L., Potvin Kent M. et al., 2019. The effectiveness of voluntary policies and commitments in restricting unhealthy food marketing to Canadian children on food company websites. Applied Physiology, Nutrition, and Metabolism, 44(1), pp. 74–82, DOI: 10.1139/apnm-2018-0528; Potvin Kent M., Smith J.R., Pauzé E. and L’Abbé M., 2018. The effectiveness of the food and beverage industry’s self-established uniform nutrition criteria at improving the healthfulness of food advertising viewed by Canadian children on television. International Journal of Behavioral Nutrition and Physical Activity, 15(1), p. 57, DOI: 10.1186/s12966-018-0694-0; Kraak V.I. and Story M., 2015. An accountability evaluation for the industry’s responsible use of brand mascots and licensed media characters to market a healthy diet to American children. Obesity Reviews, 16(6), pp. 433–53, DOI: 10.1111/ obr.12279; Galbraith-Emami S. and Lobstein T., 2013. The impact of initiatives to limit the advertising of food and beverage products to children: a systematic review. Obesity Reviews, 14(12), pp. 960–74, DOI: 10.1111/obr.12060.
-
Return to source text
Kelly B. et al., 2019. Global benchmarking of children’s exposure to television advertising of unhealthy foods and beverages across 22 countries. Obesity Reviews, 20(S2), p. 116–28, DOI: 10.1111/obr.12840
-
Return to source text
Cluss P.A., Ewing L., King W.C. et al., 2013. Nutrition knowledge of low-income parents of obese children. Translational Behavioral Medicine, 3(2), pp. 218–25.
-
Return to source text
Lorenc T., Petticrew M., Welch V. and Tugwell P., 2013. What types of interventions generate inequalities? Evidence from systematic reviews. Journal of Epidemiology and Community Health, 67, pp. 190–93.
-
Return to source text
Friel S., Hattersley L., Ford L. and O’Rourke K., 2015. Addressing inequities in healthy eating. Health Promotion International, 30(S2) pp. ii77–ii88, DOI: 10.1093/heapro/dav073
-
Return to source text
See World Cancer Research Fund International, 2018. Building momentum: lessons on implementing a robust sugar sweetened beverage tax. Available at: www.wcrf.org/int/policy/our-publications/lessons-implementingsugar-sweetened-beverage-tax
-
Return to source text
INFORMAS (International Network for Food and Obesity / Non-communicable Diseases (NCDs) Research, Monitoring and Action Support) is a global network of public-interest organisations and researchers that aims to monitor, benchmark and support public and private sector actions to increase healthy food environments and reduce obesity and NCDs and their related inequalities.
-
Return to source text
Bixby H., Bentham J., Zhou B. et al., 2019. Rising rural body-mass index is the main driver of the global obesity epidemic in adults. Nature, 569, pp. 260–64, DOI: 10.1038/s41586-019-1171-x
-
Return to source text
Thow A.M. and McGrady B., 2014. Protecting policy space for public health nutrition in an era of international investment agreements. Bulletin of the World Health Organization, 92, pp. 139–45, DOI: dx.doi.org/10.2471/BLT.13.120543
-
Return to source text
HLPE, 2017. Nutrition and food systems. A report by the High Level Panel of Experts on Food Security and Nutrition of the Committee on World Food Security, Rome.
-
Return to source text
Adams J., Mytton O., White M. and Monsivais P., 2016. Why are some population interventions for diet and obesity more equitable and effective than others? The role of individual agency. PLoS Medicine 13(4), e1001990, DOI: 10.1371/journal.pmed.1001990
-
Return to source text
Friel S., Pescud M., Malbon E. et al., 2017. Using systems science to understand the determinants of inequities in healthy eating. PLoS One 12(11), e0188872, DOI: 10.1371/journal.pone.0188872
-
Return to source text
Adams J., Mytton O., White M. and Monsivais P., 2016. Why are some population interventions for diet and obesity more equitable and effective than others? The role of individual agency. PLoS Medicine 13(4), e1001990, DOI: 10.1371/journal.pmed.1001990
-
Return to source text
Willett W., Rockström J., Loken B. et al., 2019. Food in the anthropocene: the EAT-Lancet Commission on healthy diets from sustainable food systems. The Lancet. 2–8 February.
-
Return to source text
Swinburn B.A., Kraak V.I., Allender S., et al., 2019. The global syndemic of obesity, undernutrition, and climate change: The Lancet Commission report. The Lancet, 23 February – 1 March.
-
Return to source text
The double burden of malnutrition, Lancet series, December 2019. Available at: www.thelancet.com/series/doubleburden-malnutrition
-
Return to source text
Friel S., Hattersley L., Ford L. and O’Rourke K., 2015. Addressing inequities in healthy eating. Health Promotion International, 30(S2) pp. ii77–ii88, DOI: 10.1093/heapro/dav073
-
Return to source text
Fanzo J. and Davis C., 2019. Can diets be healthy, sustainable, and equitable? Current Obesity Reports, 8, pp. 495–503, DOI: 10.1007/s13679-019-00362-0
-
Return to source text
Fanzo J. and Davis C., 2019. Can diets be healthy, sustainable, and equitable? Current Obesity Reports, 8, pp. 495–503, DOI: 10.1007/s13679-019-00362-0
-
Return to source text
See the Scaling up Nutrition movement, SUN Business Network webpage: https://scalingupnutrition.org/sunsupporters/sun-business-network/ (accessed 4 March 2020).
-
Return to source text
Scaling up Nutrition movement news from the SUN business network. Private sector role in improving nutrition at the 2019 Asian congress of nutrition: https://scalingupnutrition.org/news/private-sector-role-in-improvingnutrition- at-the-asian congress-of-nutrition/ (accessed 4 March 2020).
-
Return to source text
Acton R.B., Jones A.C., Kirkpatrick S.I. et al., 2019. Taxes and front-of-package labels improve the healthiness of beverage and snack purchases: a randomized experimental marketplace. International Journal of Behavioral Nutrition and Physical Activity, 16(46), DOI: 10.1186/s12966-019-0799-0
-
Return to source text
See: www.who.int/news-room/feature-stories/detail/denmark-trans-fat-ban-pioneer lessons-for-other-countries
-
Return to source text
World Bank, 2014. Improving children’s nutrition through cash transfers to poor mothers. Available at: www.worldbank.org/en/news/feature/2014/12/17/improving-childrens-nutrition-through-cash-transfers-to-poormothers